
British Columbia Sector Profile: Health Care
Highlights
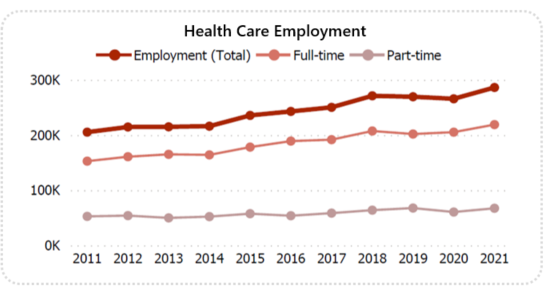
- Roughly 286,300 people were employed in British Columbia's health care sector in 2021. This represented 11.2% of employment in all industries in British Columbia.
- The short to medium-term outlook for employment is good, supported by rising demand. The process of increasing staffing levels can take years, however, due to strict education and training requirements. Workers in the sector have recently reported high levels of exhaustion and stress, with some leaving the sector as a result.
- The outlook for employment growth is driven by a growing and aging population; a continuing COVID-19 pandemic that has directly increased patient numbers and created a backlog in other procedures; and systemic staffing shortages.
- This report covers ambulatory health care services (NAICS 621); hospitals (NAICS 622); and nursing and residential care facilities (NAICS 623). The occupation in focus is registered nurses and registered psychiatric nurses.
Provincial Overview
Employment in British Columbia's health care sector reached a new high of 286,300 in 2021. Since 2011, employment in the sector rose by more than 80,000 jobs while the sector increased its share from 9.3% of the province's total employment in 2011 to 10.8% in 2021. [1]
Source: Statistics Canada Labour Force Survey, ESDC custom table
Health Care Employment
Note: Figures shown are employment estimates. Totals may not add to 100% due to rounding.
Show graphic in plain text
Year
Employment (Total)
Full-time
Part-time
2011
205,300
152,700
52,600
2012
214,700
160,800
54,000
2013
215,000
165,100
49,900
2014
216,100
164,100
52,200
2015
235,700
178,200
57,500
2016
242,900
189,100
53,800
2017
250,300
191,700
58,500
2018
271,200
207,400
63,900
2019
269,500
201,900
67,700
2020
265,800
205,300
60,500
2021
286,300
219,000
67,300
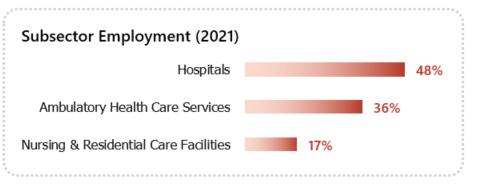
The health care sector is made up of the following three subsectors:
- 621 – Ambulatory health care services: This subsector is made up of establishments that provide health care services to patients who don't need to stay in the facility and are able to leave independently after treatment. [2]
- 622 – Hospitals: This subsector is made up of establishments, licensed as hospitals, that provide diagnostic and medical treatment services, and specialized accommodation services to in-patients. Hospitals have an organized medical staff of physicians, nurses and other health professionals, technologists and technicians. Hospitals use specialized facilities and equipment. They may also provide out-patient services as a secondary activity. [3]
- 623 – Nursing and residential care facilities: This subsector is made up of establishments focused on providing residential care combined with either nursing, supervisory or other types of care as required by the residents. In this subsector, the facilities are an important part of the production process and the care provided is a mix of health and social services, with the health component being largely nursing services. [4]
Source: Statistics Canada Labour Force Survey, ESDC custom table. Totals may not add to 100% due to rounding.
Subsector Employment (2021)
Show graphic in plain text
Subsector
% of Sector Employment
Hospitals
48%
Ambulatory Health Care Services
36%
Nursing and Residential Care Facilities
17%
Sector Trends
Demand for health care is fundamentally driven by both the size of the population and by its age characteristics. In general, larger populations require more health care services and older populations require more services than younger populations. [5]
British Columbia's population has grown at an average rate of 1.5% each year since 2011 and was estimated at 5.2 million people in 2021. The Government of British Columbia forecasts the population will rise to 6.5 million by 2041, with particularly strong growth in the Mainland/Southwest and the Nechako regions (both 1.4% annually). [6] As such, population growth will support continued higher demand for health care services in British Columbia over the long term.
The province's population is also getting older. In 2020, about 19% of the population was aged 65 or older. In 2041, seniors are forecast to make up nearly 25% of the total population. This increase means that the number of seniors is forecast to rise by 63% over the period. [7] According to this trend, British Columbia's aging population will also support increased demand for healthcare services over the long term.
While employment in health care continues to grow, the sector still faces challenges to provide the level of services sought by Canadians, particularly during the COVID-19 pandemic. In British Columbia, almost half of respondents to a 2021 Statistics Canada survey reported difficulty accessing health care services. And 14% reported that they had not received all the health care services they required. [8]
Source: Statistics Canada Labour Force Survey, ESDC custom table
Gender Distribution (2021)
Show graphic in plain text
Gender
% of Sector Employment
Female
77%
Male
23%
As a consequence of difficult work conditions during the pandemic, hospitals and nurses' associations have reported increased attrition and challenges hiring experienced nurses. [9] In October, over 4,000 British Columbia healthcare workers were placed on unpaid leave after missing the deadline for mandatory COVID-19 vaccination. [10] Hospitals have reported being forced to cut services due to staff shortages. [11]
In response to the rising demand for health care workers, the British Columbia government has announced support for additional education, training, and services to both train new health care workers and allow current workers to build on their skills. [12] [13] [14]
Source: Statistics Canada Labour Force Survey, ESDC custom table
Age Distribution (2021)
Show graphic in plain text
Age Group
% of Sector Employment
15-24 years
8%
25-54 years
70%
55+ years
22%
Occupation of Interest: Registered Nurses and Registered Psychiatric Nurses
Registered nurses and registered psychiatric nurses (referred to as “nurses” in this report) provide direct nursing care to patients, deliver health education programs and provide consultative services regarding issues relevant to the practice of nursing. They are employed in a variety of settings including hospitals, nursing homes, extended care facilities, rehabilitation centres, doctors' offices, clinics, community agencies, companies, private homes and public and private organizations, or they may be self-employed. [15]
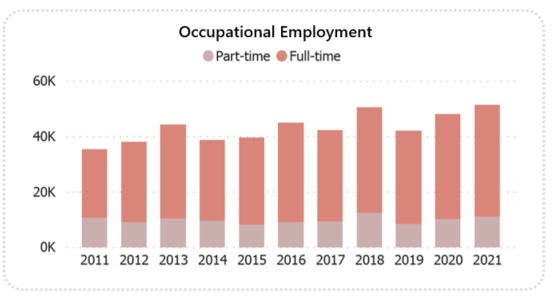
In 2021, there were 51,200 people employed as nurses in British Columbia, an increase of 65.5% from 2011. On average, the number of people employed as nurses increased 4.5% each year from 2011 to 2021. Women occupied the large majority of positions at 90.6% and this trend has changed little over the past ten years. The majority of positions were also full-time (78.3% in 2021). [16]
Source: Statistics Canada Labour Force Survey, ESDC custom table
Occupational Employment
Note: Figures shown are employment estimates. Totals may not add to 100% due to rounding.
Show graphic in plain text
Year
Employment (Total)
Full-time
Part-time
2011
35,300
24,700
10,600
2012
37,900
28,900
9,000
2013
44,100
33,600
10,500
2014
38,600
29,000
9,600
2015
39,400
31,100
8,300
2016
44,900
35,900
9,000
2017
42,200
32,900
9,300
2018
50,500
38,000
12,400
2019
42,000
33,500
8,500
2020
48,000
37,700
10,300
2021
51,200
40,100
11,200
Overall in British Columbia, about 4.6% of the employed population in 2021 was Indigenous. In this occupation, Indigenous employees represent 5.5% of workers. [17]
For registered nurses in British Columbia, 65.5% worked in hospitals in 2020, with 16.7% in community health, and 6.1% in long-term care facilities. The main responsibility for almost all (95.9%) of registered nurses was direct care, with small percentages working in administration, education, and research. [18]
There are a number of types of nurses including:
- General duty registered nurses who may assess patients; collaborate with members of a health team to care for patients; administer medications and treatments; operate or monitor medical equipment; be specialized in areas such as surgery, obstetrics, psychiatric care, and pediatrics.
- Occupational health nurses who develop and implement health education programs and provide nursing care in a corporate or industry environment.
- Community health nurses who may provide health education and registered nursing care in public health units and through home visits; manage complex home care cases; participate in community needs assessment and program development; conduct disease screening; and deliver immunization programs.
The median wage for nurses in Canada in 2020 was $40.00 per hour; in British Columbia the median wage was $41.00 per hour, with a low of $37.00 and a high of $47.00. Three regions of the province reported lower than median wages: Nechako ($38.10), North Coast ($38.10), and Kootenay ($40.00). Wages were at the provincial median of $41.00 per hour in the large Lower Mainland-Southwest region, and were higher than median in Northeast ($44.00), Thompson-Okanagan ($43.00), and Vancouver Island and Coast ($42.00). [19]
For more information on the job description, job duties, job titles, and related occupations, please see the profile of Registered nurses and registered psychiatric nurses, which includes up to date information on wages and job prospects.
Employment Outlook
There are a number of reasons for the good outlook on employment in British Columbia's health care sector.
The province's population is forecast to continue growing and to continue getting older; both trends will lead to higher demand for health care services.
While systemic staffing shortages may persist, further attrition from occupations in health care should translate into employment opportunities. The COVID-19 pandemic has increased the demand on hospitals and clinics. Not only have cases of Covid directly led to health care workers missing work due to illness, but the additional pressure of treating Covid patients has increased stress and exhaustion for many health care workers. The need to re-direct resources to treat Covid patients has also meant that other services and procedures have been delayed, creating a backlog in demand.
New workers will be needed in the health care sector to meet increasing needs from a growing and aging population; to replace workers who retire or leave the sector for other reasons; and to address the backlog in services exacerbated by the Covid-19 pandemic.
Note
In preparing this document, the authors have taken care to provide clients with labour market information that is timely and accurate at the time of publication. Since labour market conditions are dynamic, some of the information presented here may have changed since this document was published. Users are encouraged to also refer to other sources for additional information on the local economy and labour market. Information contained in this document does not necessarily reflect official policies of Employment and Social Development Canada.
Prepared by: Labour Market Information (LMI) Directorate, Service Canada, Western Canada and Territories Region
For further information, please contact the LMI team
Endnotes
-
Statistics Canada, Labour Force Survey. ↑
-
Statistics Canada, NAICS 2017 Version 3.0 - 621 - Ambulatory health care services. ↑
-
Statistics Canada, NAICS 2017 Version 3.0 - 622 - Hospitals. ↑
-
Statistics Canada, NAICS 2017 Version 3.0 - 623 - Nursing and residential care facilities. ↑
-
Lele Li, Tiantian Du, and Yanping Hu (August 31, 2020). The Effect of Population Aging on Healthcare Expenditure from a Healthcare Demand Perspective Among Different Age Groups: Evidence from Beijing City in the People's Republic of China. Risk Management Healthcare Policy. ↑
-
Government of British Columbia, BC Stats. PEOPLE 2020: BC Sub-Provincial Population Projections. ↑
-
Ibid. ↑
-
Statistics Canada (November 23, 2021). Survey on Access to Health Care and Pharmaceuticals During the Pandemic. ↑
-
Catherine Varner, CMAJ News (March 31, 2021). Hospitals grappling with nurse exodus. ↑
-
Lisa Cordasco, Vancouver Sun (October 27, 2021). COVID-19: Surgeries, tests postponed as 4,000 unvaccinated B.C. health-care workers put on leave. ↑
-
Jane Seyd, North Shore News (October 26, 2021). Patients face more surgery delays and cancellations at Lions Gate. ↑
-
Government of British Columbia, Ministry of Advanced Education, Skills and Training (July 23, 2020). BC students to get health education for in-demand jobs. ↑
-
Government of British Columbia, Ministry of Health (September 14, 2021). Boosting support, hiring to enhance services in Northern Health. ↑
-
The Canadian Presss, Vancouver Sun (July 24, 2020). B.C. announces new funding for post-secondary health-care education, training. ↑
-
Government of Canada: Job Bank, Registered Nurse (R.N.) in Canada. ↑
-
Statistics Canada: Labour Force Survey. Custom Table. ↑
-
Ibid. ↑
-
Canadian Institute for Health Information. Health Workforce in Canada, 2020 – Quick Stats. ↑
-
Government of Canada: Job Bank, Registered Nurse (R.N.) in Canada. ↑
- Date modified: