
Economic Scan - Ontario: 2026
Demographics

Highlights
- 16.2 million people lived in Ontario in 2025, an increase of 0.2% from 2024. Ontario represents 38.9% of Canada’s total population
- The proportion of seniors aged 65+ is projected to increase from 18.8% in 2025 to 22.5% in 2035.
- In 2025, individuals aged 55-64 accounted for 18.8% of the working-age population (aged 15-64). By 2035, that proportion could fall to 16.7%.
- The proportion of youth (15-29) is projected to decline from 20.3% in 2025 to 19.1% in 2035.
- Labour force participation has risen amongst workers aged 65 and over in recent years as the cost of living has increased.
Indigenous peoples accounted for 2.2% of the Ontario labour force as of 2025.
Ontario has the largest proportion of recent immigrants arriving in Canada, with 44.0% of recent immigrants who arrived between 2016 and 2021. In 2025, Canada welcomed 393,530 new permanent residents, a decrease of 18.6% compared to the previous year, as about 43.1% settled in Ontario. Immigration, Refugees and Citizenship Canada has set a goal of about 380,000 new permanent residents for 2026, a decrease of 3.8% from 2025.
The official-language minority community in Ontario represented 4.1% of the provincial population (2021 Census) and is prevalent mostly in the Northeast Ontario and Ottawa economic regions.
In 2022, 28.0% of the Ontario population aged 15 and over were persons with disabilities. The 2022 Canadian Survey on Disability revealed that persons with disabilities are more likely to be employed in Canada than in the past
Labour Market Conditions
Ontario in 2025...
Employment continued to make gains (+1.0%)
Unemployment rose (+12.4%)
Participation rate remained stable (65.3% to 65.0%)
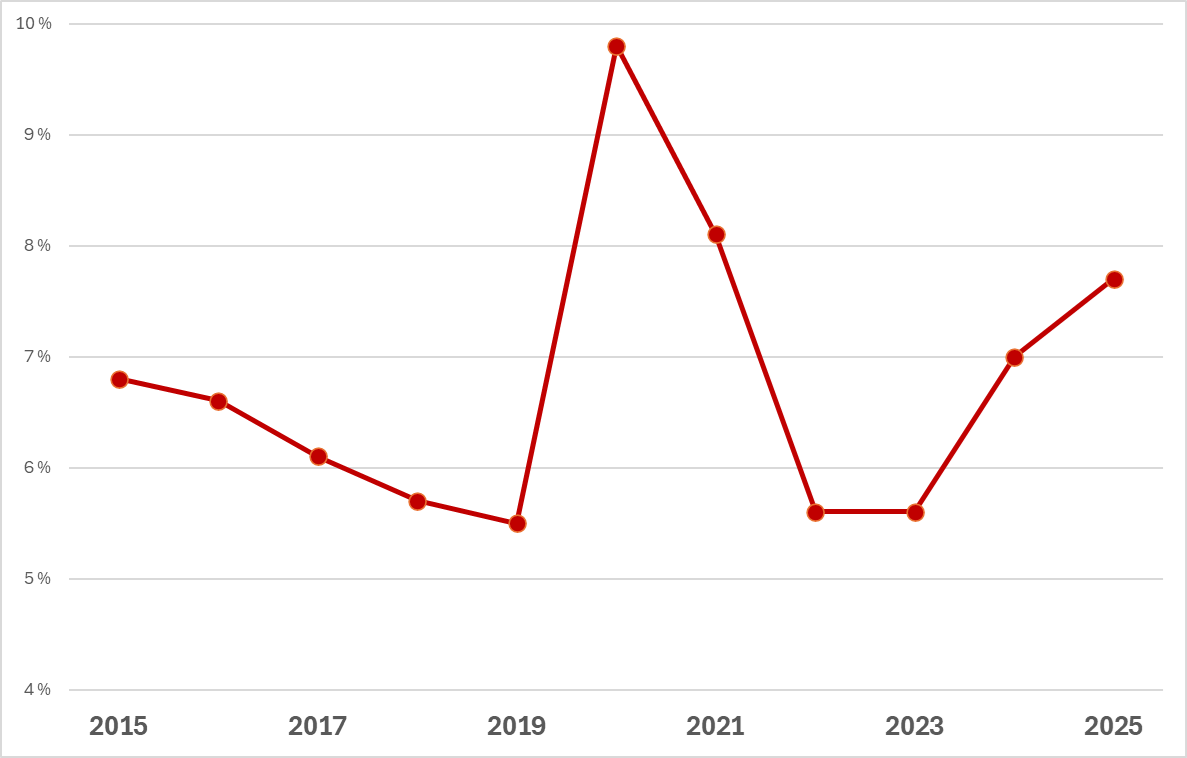
Unemployment rate increased (7.0% to 7.7%)
Show data table
| Year | Unemployment Rate(%) |
|---|---|
| 2015 | 6.8 |
| 2016 | 6.6 |
| 2017 | 6.1 |
| 2018 | 5.7 |
| 2019 | 5.5 |
| 2020 | 9.8 |
| 2021 | 8.1 |
| 2022 | 5.6 |
| 2023 | 5.6 |
| 2024 | 7.0 |
| 2025 | 7.7 |
Ontario in 2026...
- Employment growth will remain minimal in 2026, as businesses continue to face trade-related uncertainty, soft consumer spending, and higher operating costs.
- The unemployment rate is likely to remain elevated in 2026.
Economic Conditions
Ontario’s Economic Factors in 2025
Rising unemployment rates
Weak employment gains
Trade uncertainty and cautious business investment environment
Show data table
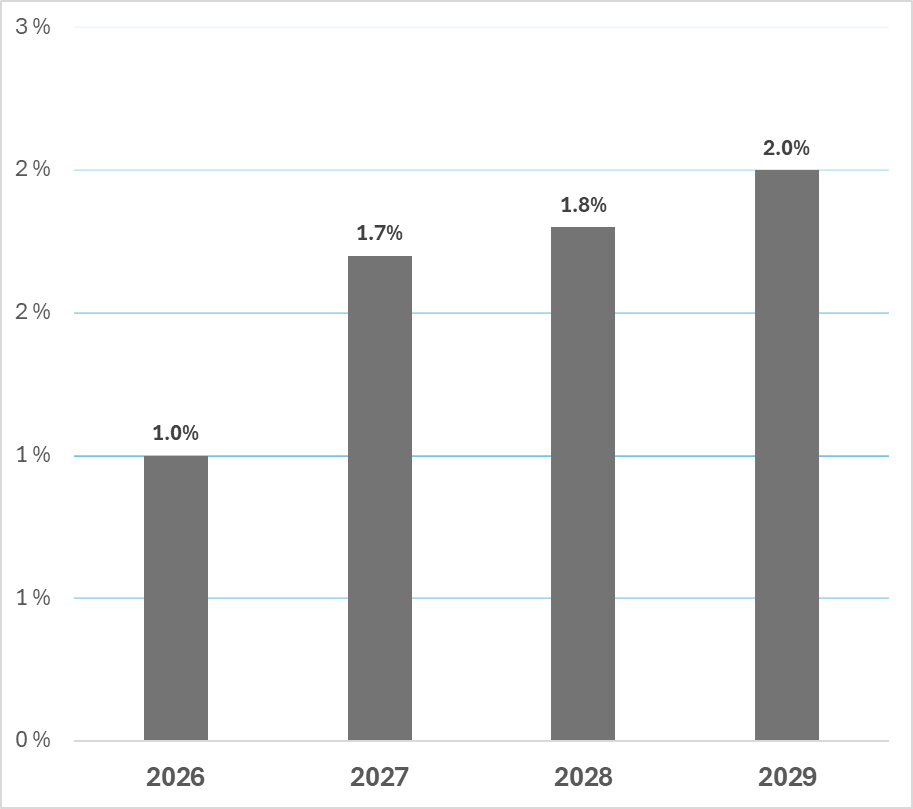
| Year | Real GDP Projected Growth Rate |
|---|---|
| 2026 | 1.0% |
| 2027 | 1.7% |
| 2028 | 1.8% |
| 2029 | 2.0% |
Reviewing 2025
- Ontario’s economy continued to face headwinds in 2025, with slower growth driven by U.S. tariffs and weaker global conditions. Despite this, the province avoided a sharp downturn and maintained modest economic activity.
- Ontario inflation continued to moderate in 2025, with the Consumer Price Index averaging about 1.9% over the year, remaining within the Bank of Canada’s 1.0 – 3.0% target range.
- Ontario’s real GDP is projected to grow by about 0.8% in 2025, reflecting a slowdown from 2024. Forecasts for 2026 suggest similarly muted growth.
Risks to the Ontario Economy in 2026
- Persistent U.S. tariffs and ongoing trade uncertainty continue to weigh on Ontario’s exports and business investment.
- Slower labour force growth driven by tighter federal immigration policies and declining population growth is expected to constrain labour supply, dampen consumer spending, and limit economic momentum.
- Weak business confidence persist, with only a small share of firms planning to increase capital spending in 2026 amid high costs and uncertainty
- Rising affordability pressures across housing, energy, and essential goods continue to constrain household budgets in Ontario, limiting discretionary spending and slowing broader economic activity.
Regional Issues
Wages and Low-income populations
About 10.1% of Ontario’s population were in low-income status, according to the 2021 Census. The prevalence of low-income was especially high for those living alone, and those living in a single-parent household.
Average wages went up by 3.5% in 2025, higher than the Ontario inflation rate of 1.9%.
Small-Medium Enterprises (SMEs)
Small enterprises (1-99 employees) represented 97.9% of businesses with at least one employee in Ontario and employed 36.5% of employees in Ontario as of June 2025.
Medium-sized enterprises (100-499 employees) represented 1.8% of businesses with at least one employee in Ontario and employed 15.4% of employees in Ontario as of June 2025.
Large enterprises (500+ employees) represented 0.3% of businesses with at least one employee in Ontario and employed 48.1% of employees in Ontario as of June 2025.
Industry Trends

Show data table
| Industry (NAICS) | Employment Change ('000s) |
|---|---|
| Information, culture and recreation | 26.7K (-8.9%) |
| Wholesale and retail trade | 25.2K (3%) |
| Accommodation and food services | 18.7K (11.4%) |
| Health care and social assistance | 14.7K (-0.2%) |
| Finance, insurance, real estate, rental and leasing | 14.5K (-1%) |
| Professional, scientific and technical services | 11.1K (2.2%) |
| Utilities | 6.8K (-0.9%) |
| Forestry, fishing, mining, quarrying, oil and gas | 1.3K (2.1%) |
| Other services (except public administration) | -0.8K (1.2%) |
| Public administration | -1K (-4.2%) |
| Construction | -1.4K (-0.7%) |
| Transportation and warehousing | -3.7K (1.5%) |
| Educational services | -4.4K (8.2%) |
| Agriculture | -6.4K (4.4%) |
| Manufacturing | -8.4K (-0.3%) |
| Business, building and other support services | -12.2K (-0.2%) |
- Employment declined in the goods-producing sector (-0.5%) and increased in the services-producing (+1.4%) sector in 2025 in Ontario.
- Utilities (+11.4%), information, culture and recreation (+8.2%) and accommodation and food services (+4.4%) had the highest employment growth among sectors in Ontario.
- Agriculture (-8.9%), business, building and other support services (-4.2%) and finance, insurance, real estate, rental and leasing (-2.1%) observed the highest losses in employment in 2025.
Regional Economic Conditions
- Employment levels grew in six of eleven economic regions in Ontario in 2025.
- Northeast Ontario (+3.4%), Northwest Ontario (+2.8%) and Hamilton-Niagara Peninsula (+2.3%) observed the highest employment growth in Ontario.
- Employment fell the in Muskoka-Kawarthas (-1.7%), Ottawa (-1.2%) and Kingston-Pembroke (-0.7%) economic regions.

Show data table
| Region | Employment Change (% and 000s) |
|---|---|
| Northeast | 3.4% (9.30) |
| Northwest | 2.8% (2.90) |
| Hamilton-Niagara Peninsula | 2.3% (19.10) |
| London | 1.5% (6.40) |
| Toronto | 1.4% (55.80) |
| Ontario | 1.0% (80.90) |
| Kitchener-Waterloo-Barrie | 0.5% (4.70) |
| Stratford-Bruce Peninsula | -0.3% (-0.50) |
| Windsor-Sarnia | -0.4% (-1.40) |
| Kingston-Pembroke | -0.7% (-1.70) |
| Ottawa | -1.2% (-10.30) |
| Muskoka-Kawarthas | -1.7% (-3.40) |
Page details
- Date modified: