Agriculture (NAICS 11): Ontario, 2024-2026
HIGHLIGHTS
- There were 78,900 people employed in Ontario‘s agriculture industry, comprising 1.0% of Ontario‘s total workforce in 2023.
- Employment in the agriculture industry grew by 10.5% in 2023, after increasing by 7.5% in 2022.
- Over the 2024 to 2026 period, the agriculture industry is expected to experience a small decline in employment.
- The industry is facing labour supply shortages as the domestic workforce ages and has increasingly become more reliant on temporary foreign workers to operate farms.
ABOUT THE SECTOR
Composition and importance of the sector
The agriculture sector is comprised of firms that are engaged in growing crops and raising animals. This sector includes establishments that operate farms, orchards, groves greenhouses, ranches, and feedlots engaged in growing crops, and raising animals.
In 2023, the sector employed 78,900 people, comprising 1.0% of Ontario‘s total employment. The sector contributed $9.1 billion to the provincial economy in 2023, accounting for 1.0% of Ontario‘s total GDP. GDP increased by 2.4% in 2023, following an increase of 7.7% in 2022.
The Ontario agriculture sector is a significant contributor to Canadian agriculture as a whole. According to Statistics Canada‘s 2021 Census of Agriculture, Ontario made up the largest proportion of Canada‘s farms and farm operators. Additionally, Ontario was the second largest contributor to Canada‘s farm operating revenues and was the provincial leader in soybean, corn, and greenhouse products.
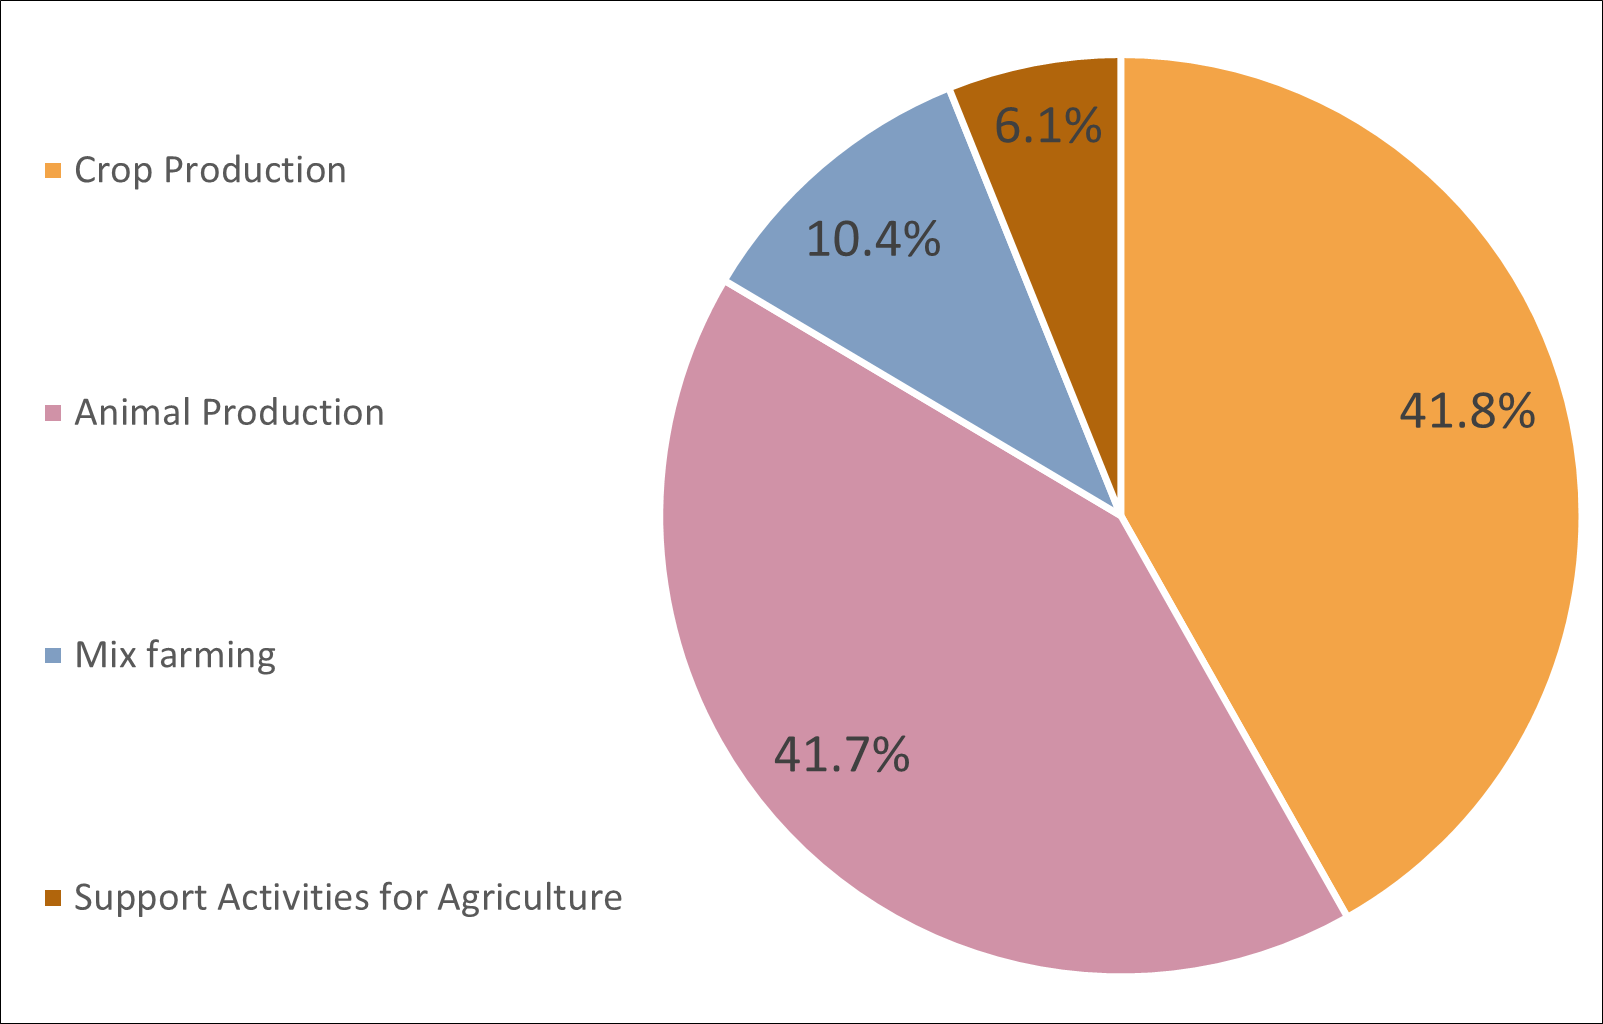
According to the 2021 Census of Agriculture, there were 48,346 farms in Ontario, with the largest number of farms in oilseed and grain farming, followed by cattle ranching and farming, other crop farming, other animal production, and poultry and egg production.
Graph 1. Employment Share by Subsector
Source: Statistics Canada, Custom Table
Show graphic in plain text
Geographical distribution of employment
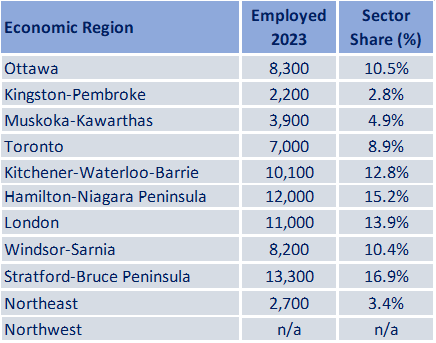
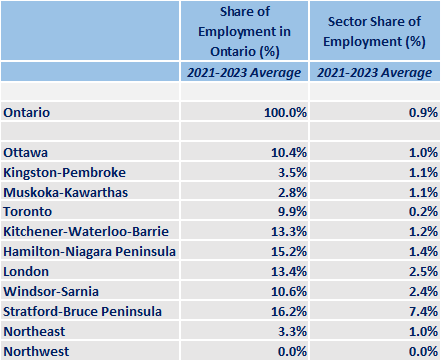
In 2023, employment in agriculture was most prevalent in the Stratford-Bruce Peninsula Economic Region (ER), where 16.9% of Ontario‘s agriculture workers were employed (13,300 individuals). About 8.6% of Stratford-Bruce Peninsula‘s total employment is in agriculture, a much larger proportion compared to any other economic region in Ontario. The second largest employment cluster is in the Hamilton-Niagara Peninsula ER, where 15.2% of Ontario‘s agricultural employment is located. The Northwest and Kingston-Pembroke ERs have the least employment in this industry.
Table 1. Employment by Economic Region
Source: Statistics Canada, Labour Force Survey, Custom Table
Show table in plain text
WORKFORCE
Workforce characteristics
- In 2023, 41.3% (29,048) of Canada‘s agricultural Temporary Foreign Workers (TFWs) were employed in Ontario.
- About 52.3% of workers in the Ontario agriculture sector are self-employed, compared to 13.6% in the provincial labour market as a whole.
- The agriculture industry in Ontario has an aging workforce ; 43.9% of workers are over the age of 55. In comparison, only 21.8% of workers employed across all industries are over the age of 55.
- Employment in this sector skews disproportionately towards men, with women making up only 35.6% of the workforce. In comparison, women make up 47.4% of the total provincial workforce.
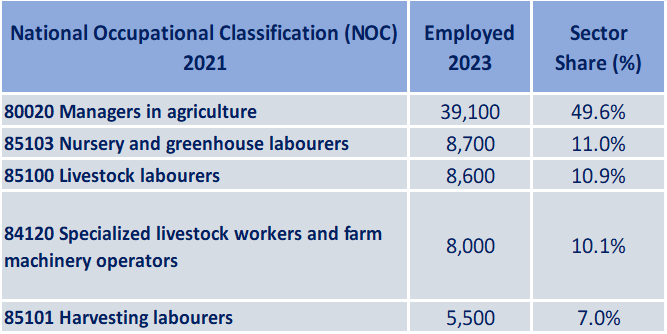
Table 2. Top 5 Occupations
Source: Statistics Canada, Labour Force Survey, Custom Table
Show table in plain text
RECENT HISTORY
The Ontario agricultural sector is a significant contributor to the nation‘s agricultural industry as a whole. According to the 2021 Census of Agriculture, Ontario made up the largest share of farms and farm operators, and was the second largest contributor of farm revenues across the country. However, the total number of farms in the province declined by 2.5% to 48,346 from 2016 to 2021, likely influenced both by industry consolidation and aging farm operators.The Census of Agriculture illustrated that the number of large farms is trending upward, with the number of farms operating as sole proprietorships and family corporations falling, while non-family corporations remained steady and partnerships increased. This illustrates that while the overall number of farms is declining, the average farm is larger. Sheep and goat farming, poultry and egg production, and cattle ranching and farming had the sharpest growth in the number of farms from 2016 to 2021, while other crop farming experienced the sharpest decline.
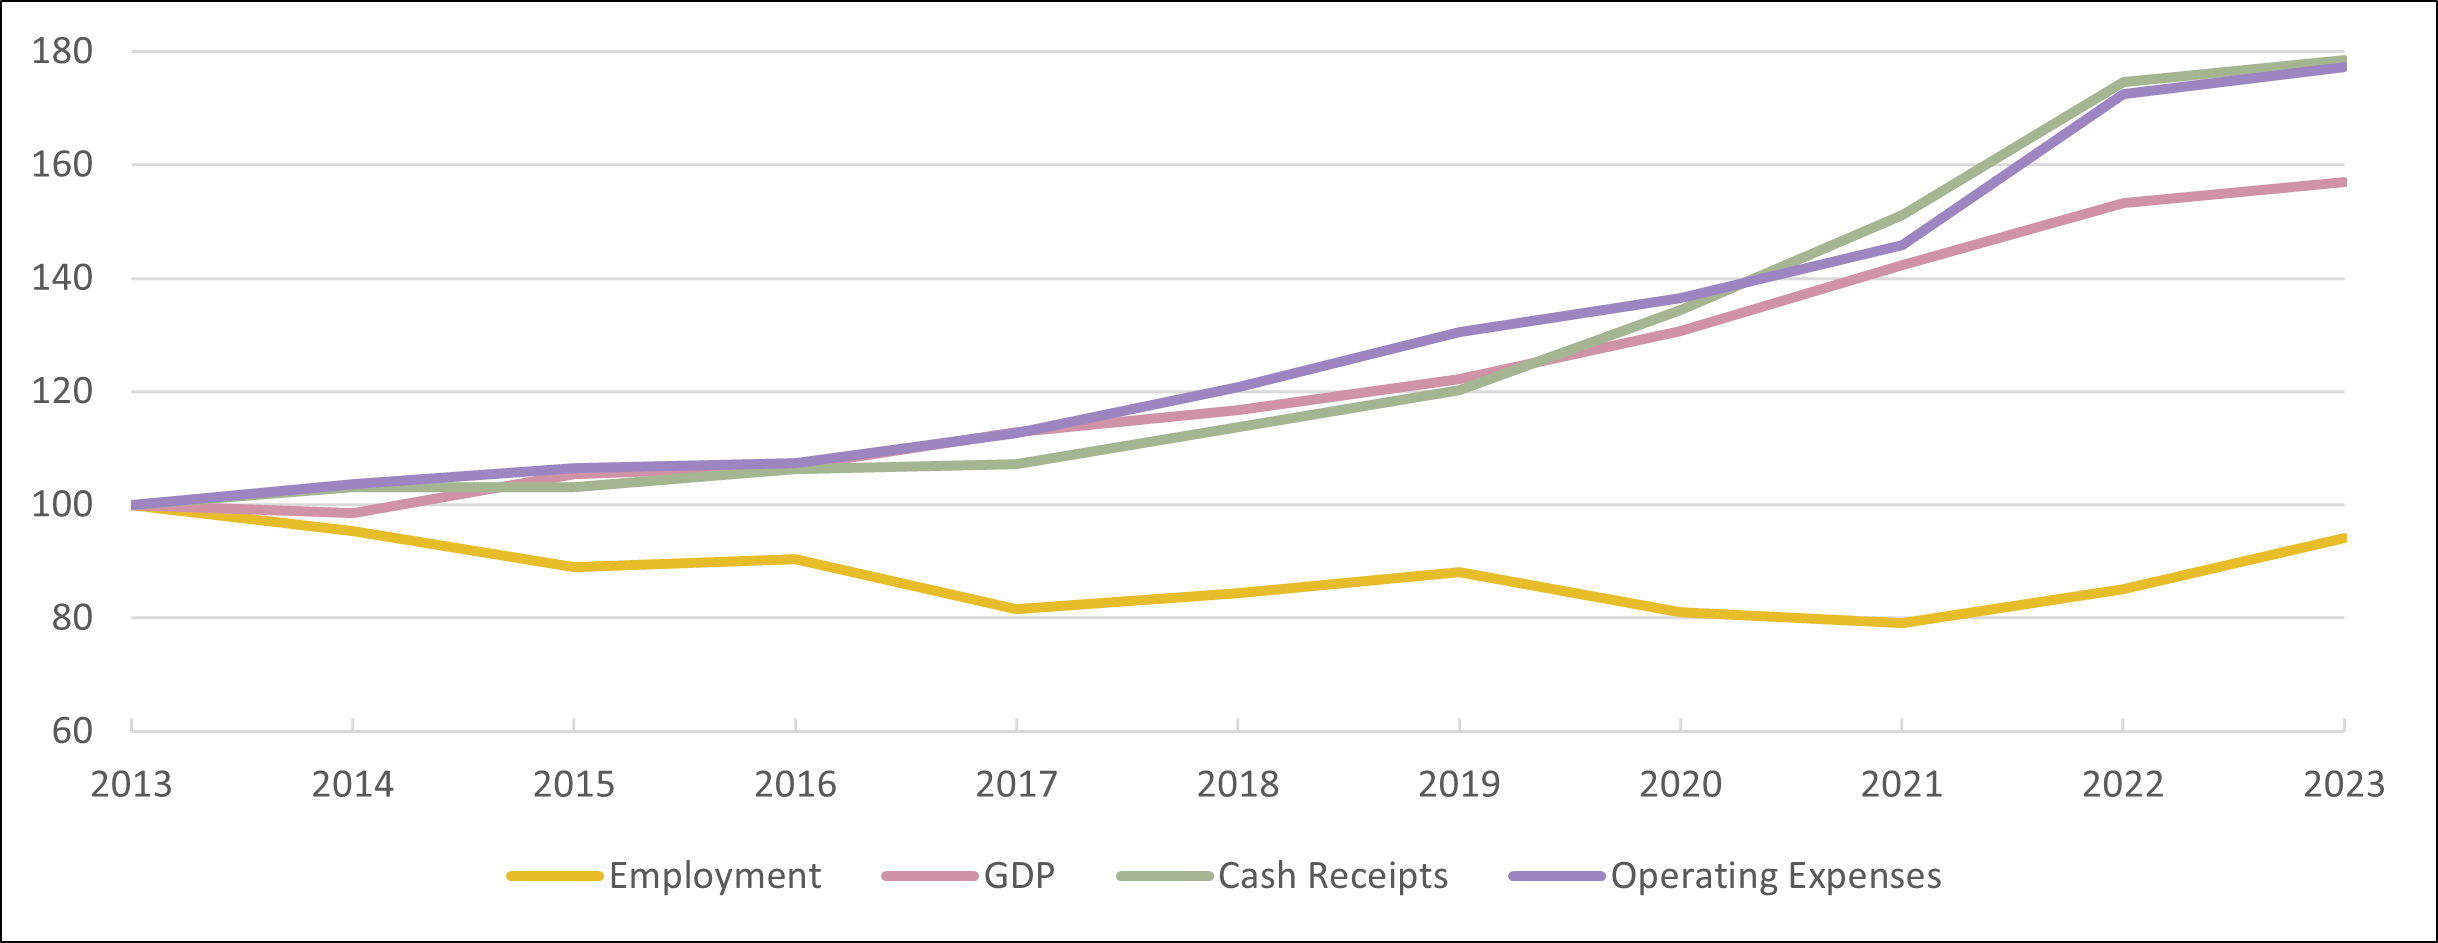
Employment in the agricultural sector was on a near steady decline over the last decade, but has seen a resurgence in the past several years. In 2023, employment grew by 7,500 (+10.5%), after also growing from 2021 to 2022. Historically, the sector has consistently struggled with labour shortages due to an aging workforce and a heavy reliance on temporary foreign workers. The average age of farm operators increased from 55 years old in 2016 to 57 in 2021. Additionally, the pandemic accelerated labour shortages in the industry, due to interruptions to the regular flow of temporary foreign workers arriving in Ontario. Since then, the supply of temporary foreign workers increased for three consecutive years, with 29,048 farm workers hired in 2023, primarily in greenhouse, nursery and floriculture production.
Graph 2. Sector Employment, Sector GDP, Farm Cash Receipts and Farm Operating Expenses in Ontario
Source: Statistics Canada, Labour Force Survey, Custom Table
*Data are expressed as index where year 2013 = 100%
Show graphic in plain text
EMPLOYMENT OUTLOOKS
Over the 2024 to 2026 period, the agricultural industry may experience slight employment decline in Ontario; the demand for workers will remain high, but other factors may constrain overall employment levels.
The agricultural industry is facing ongoing difficulties with attracting and retaining labour in Ontario. Some reasons include strenuous working conditions, seasonality, rural work locations, and competition from other industries. The Canadian Agricultural Human Resource Council (CAHRC) found that by 2030, there could be more than 100,000 vacant jobs to fill in the industry across Canada.Additionally, a report from the Royal Bank of Canada estimated that 40% of Canadian farmers will retire by 2033. These estimations, plus past trends, indicate that labour shortages are an issue that will continue to plague the agricultural industry. However, the Conference Board of Canada estimated that increases in productivity and technological advances could possibly lead to up to a third of all agriculture jobs in Canada becoming automated over the next decade, which would offset some of the issues created by a lack of workers. Additionally, immigration and temporary foreign workers will continue to be the main policy instruments to address the labour shortages in this industry.
Changes in agricultural automation and the use of artificial intelligence (AI) may also help offset the labour supply shortages. Provincial and federal governments have invested in programs, including the Agri-Tech Innovation Initiative, to provide funding towards innovative technology, equipment or processes that will expand production capacity or enhance efficiency on farms and food processing businesses.
Climate change is another key trend that will affect the outlook for this sector over the forecast period. Agricultural production is highly dependant on weather conditions and climate change will bring both challenges and opportunities. In Ontario, warmer weather will extend the growing season, but extreme changes in temperatures could stress crops, as well as affect livestock health. Additionally, extreme weather events may slow down the performance of agricultural labourers, as more breaks and days off are needed during heat warnings or heavy rainfall. Accordingly, production may fluctuate, creating instability for workers.
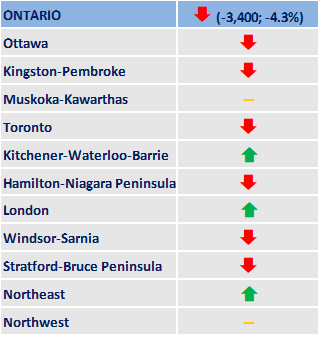
Table 3. Employment Change in Agriculture: July 2019 vs. July 2024
Source: Statistics Canada, Labour Force Survey, Custom Table
Show graphic in plain text
Key trends affecting the outlook of the agriculture sector
- Lack of labour supply
- Production challenges due to climate change
- Technological advancements, including automation and AI
FOR FURTHER INFORMATION
Note: In preparing this document, the authors have taken care to provide clients with labour market information that is timely and accurate at the time of publication. Since labour market conditions are dynamic, some of the information presented here may have changed since this document was published. Users are encouraged to also refer to other sources for additional information on the local economy and labour market. Information contained in this document does not necessarily reflect official policies of Employment and Social Development Canada.
Prepared by: Labour Market and Socio-economic Information Directorate, Service Canada, Ontario Region
For further information, please contact LMSID at: Contact: Labour Market Information - Canada.ca (services.gc.ca)
APPENDIX
Table A1. Geographical Distribution of the Sector
Source: Statistics Canada, Labour Force Survey, Custom Table
Show graphic in plain text
Table A2. Characteristics of Employed Persons

Source: Statistics Canada, Labour Force Survey, Custom Table
*Average annual growth rate for last ten years available data
Show table in plain text
| Agriculture | All Sectors | |||||
|---|---|---|---|---|---|---|
| Employment, 2023 | Share of Total (%) | AAGR (%)* | Share of Total (%) | AAGR (%)* | ||
| Employment | 78,900 | 100.0% | -0.4% | 100.0% | 1.6% | |
| Male | 50,800 | 64.4% | -1.0% | 52.6% | 1.7% | |
| Female | 28,100 | 35.6% | 1.3% | 47.4% | 1.4% | |
| 15-24 years old | 9,000 | 11.4% | -4.4% | 13.2% | 1.3% | |
| 25-54 years old | 35,200 | 44.6% | -0.7% | 65.0% | 1.2% | |
| 55 years and older | 34,600 | 43.9% | 3.7% | 21.8% | 3.0% | |
| Worked full-time | 61,600 | 78.1% | -0.6% | 82.7% | 1.8% | |
| Worked part-time | 17,300 | 21.9% | 0.9% | 17.3% | 0.3% | |
| Self-employed | 41,300 | 52.3% | -1.3% | 13.6% | 0.4% | |
| Employees | 37,600 | 47.7% | 1.4% | 86.4% | 1.8% | |
| Permanent job | 30,300 | 38.4% | 2.4% | 76.6% | 1.9% | |
| Temporary job | 7,300 | 9.3% | -1.3% | 9.7% | 0.9% | |
| Less than high school | 14,200 | 18.0% | -4.4% | 6.1% | -2.1% | |
| High school graduate | 26,600 | 33.7% | -1.2% | 22.3% | -0.4% | |
| Postsecondary cert. or diploma | 29,100 | 36.9% | 1.3% | 32.3% | 1.3% | |
| University degree | 13,900 | 17.6% | 6.5% | 39.3% | 4.1% | |