
Utilities (NAICS 22): Ontario, 2024-2026
HIGHLIGHTS
- There were 63,200 people employed in Ontario‘s utilities industry, comprising 0.8% of Ontario‘s total workforce in 2023.
- Employment in the Ontario‘s utilities industry increased by 5.3% in 2023.
- Employment growth is expected to maintain an upward trend for the 2024-2026 forecast period, driven by the high demand for labour in the industry.
- A number of initiatives and investments have been launched in the Ontario‘s utilities sector to continue to innovate the energy sources that will form the electricity grid in the province in the coming years.
ABOUT THE SECTOR
Composition and importance of the sector
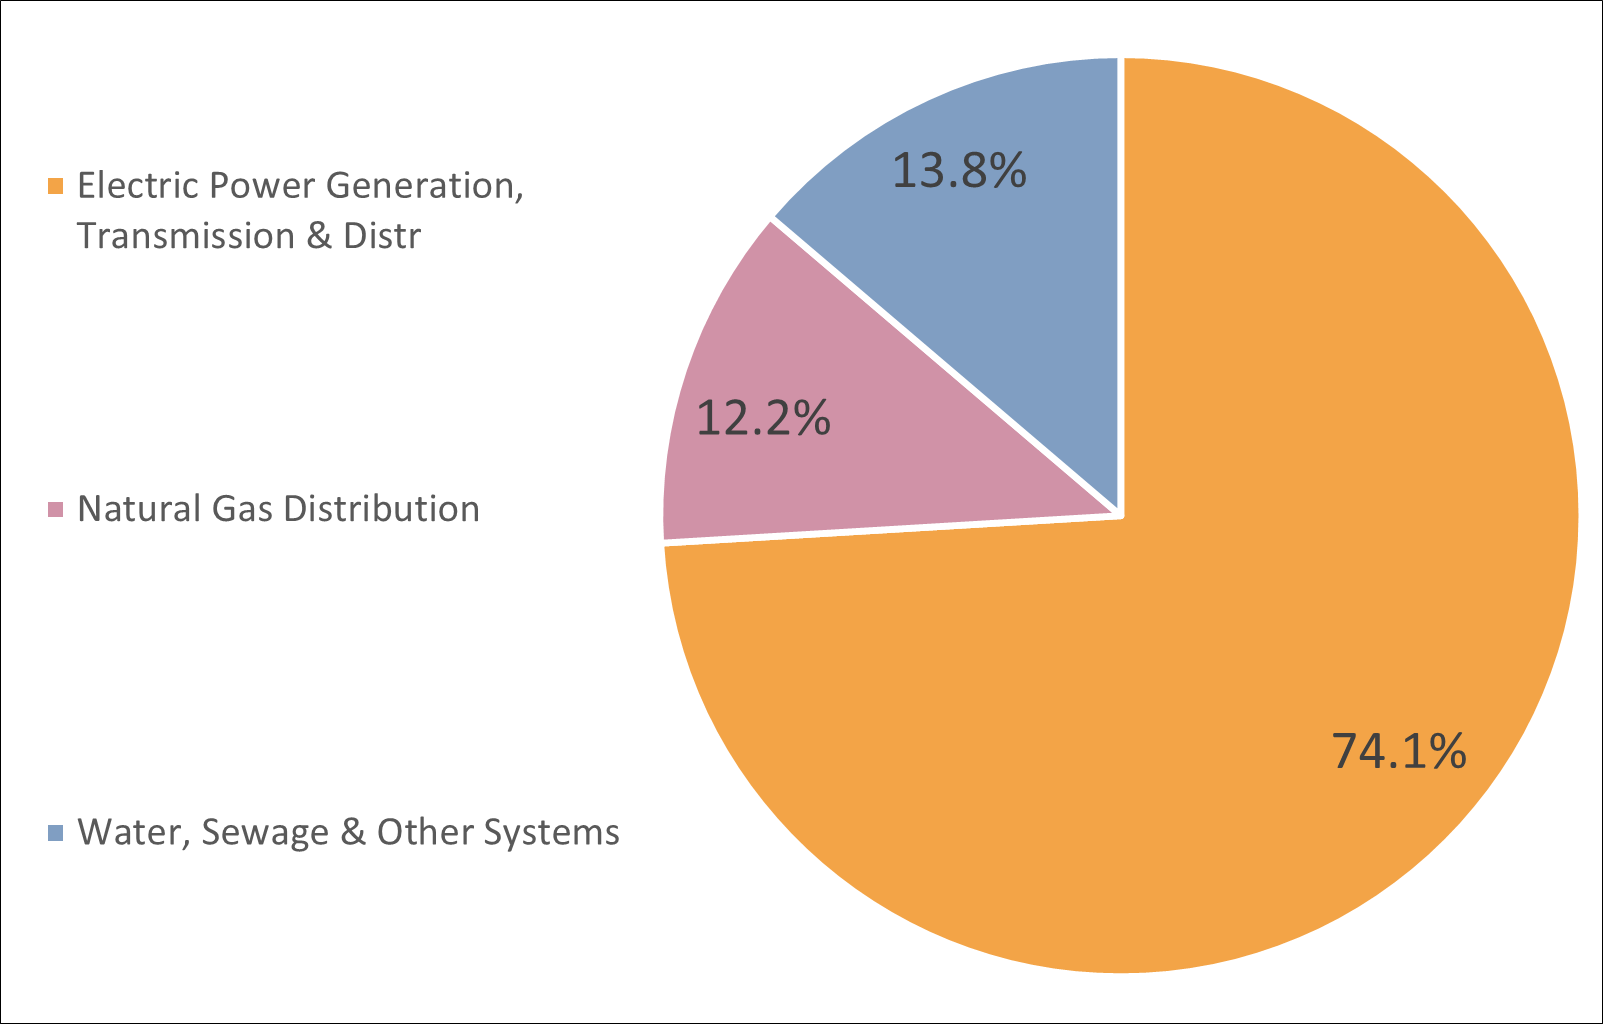
The utilities industry is comprised of three sub-industries: electric power generation, transmission and distribution; natural gas distribution; and water, sewage and other systems.
In Ontario, the utilities industry comprised 0.8% of the total provincial workforce in 2023, with 63,200 people employed. This represents an increase of 3,200 people (+5.3%) from 2022. The utilities industry across Canada also comprises 0.8% of the national workforce.
The Ontario utilities industry produced over $14.7 billion in gross domestic product (GDP) in 2023, contributing 1.7% to the province‘s total GDP. This was an increase of 2.0% (+$292.6 million) from 2022.
Graph 1. Employment Share by Subsector
Sources: Statistics Canada, Labour Force Survey, Custom Table
Show graphic in plain text
Geographical distribution of employment
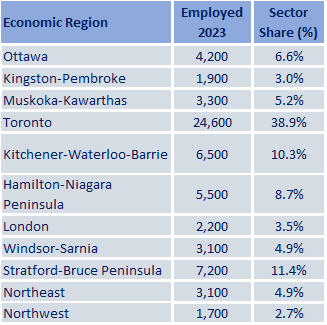
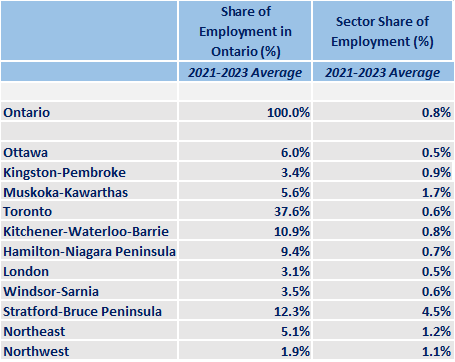
A moderate share of employment in the Ontario utilities industry is found in the Toronto Economic Region (ER) (38.0%), followed by Stratford-Bruce Peninsula ER (11.4%) and Kitchener-Waterloo-Barrie ER (10.3%).
Ontario represents 40.8% of the Canadian employment in utilities, slighly higher than its share of Canada‘s employment as a whole (39.2%).
Employment in the Ontario utilities industry is highly over-represented in the Stratford-Bruce Peninsula ER, due to the presence of the Bruce Nuclear Generating Station, as well as in Muskoka-Kawarthas ER and Northwest ER. The utilities industry accounted for 4.6% of employment in the Stratford-Bruce Peninsula ER, compared to 0.8% for Ontario as a whole, while it accounted for 1.7% of employment in the Muskoka-Kawarthas ER and 1.6% of employment in the Northwest ER.
Table 1. Employment by Economic Region
Source: Statistics Canada, Labour Force Survey, Custom Table
Show table in plain text
WORKFORCE
Workforce characteristics
- Males accounted for about 72.9% of Ontario‘s utilities workforce in 2023, compared to 52.6% for all industries.
- Virtually all workers in this industry were employees in 2023, with almost no self-employment, compared to 13.6% self-employment across all industries in Ontario.
- Ontario‘s utilities industry had no employees working part-time, compared to the prevalence of part-time work in the overall provincial workforce (17.3%).
- Youth (aged 15 to 24) in the province made up 4.1% of utilities employees, compared to 13.2% for all industries.
- Older workers (aged 55 and over) comprised 18.8% of the subsector in Ontario, compared to 21.8 for all industries.
- About 51.6% of employees in the sector had post-secondary certificates or diplomas in 2023, which was considerably higher than across all industries in the province (32.3%).
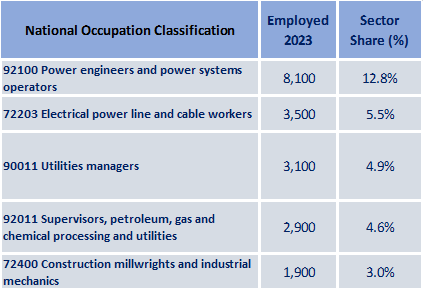
Table 2. Top 5 Occupations
Source: Statistics Canada, Labour Force Survey, Custom Table
Show table in plain text
RECENT HISTORY
The Government of Ontario through the Ministry of Energy, Northern Development and Mines sets the overall framework for the power, natural gas, and drinking water industries. The electricity and municipal water markets are largely public while the natural gas industry is mainly private.
Electric power generation, transmission and distribution: Ontario is the second largest producer of electricity in Canada. Increased conservation, a shift to less energy-intensive industries, and use of varied energy resources has helped balance increased demand from population growth and denser urban centres. As well, there has been a trend towards greater use of smart home technologies and energy management and communication software as homeowners and businesses seek out energy-saving options.
In general, there has been a significant shift in the sources of electricity used in the province over the past decade. Nuclear and renewable power such as water, solar, and wind are becoming more dominant, as the use of fossil-fuelled power declines. Currently, nuclear power facilities are located in Pickering, Clarington and Kincardine . Ontario Power Generation (OPG) started refurbishment work on four reactors at its Darlington Nuclear Generating Station (GS) in October 2016, which is expected to be completed by 2026. The project will support operations at the site until 2055 and cost $12.8 billion to complete. Likewise, Bruce Power started refurbishment activities on six reactors at its Bruce Nuclear GS in 2020. The project will extend the lifetime of the plant until 2064 and will cost $13.0 billion over 13 years. Since some of the reactors will be shut down throughout these projects, OPG will delay the closure of the Pickering Nuclear GS to 2025, however, they are currently seeking approval to extend through 2026 to help meet energy needs.
Natural gas distribution: Employment in natural gas distribution in Ontario decreased steadily through both 2020
(-16.2%) and 2021 (-6.5%); however, it significantly picked up in 2022 (+79.3%) and 2023 (+48.1).
Expansion of the natural gas network across the province to improve community access with new pipelines and infrastructure has been ongoing for some time. This will provide increased access to those in rural areas, First Nations communities, and support business growth for large end users such as farmers and manufacturers.
Water, sewage and other systems: Employment in this sub-industry saw significant increases of 23.7% in 2021 and 46.6% in 2022. Despite a notable decrease in employment in 2023 (-18.7%), the employment remained above pre-pandemic levels.
Recent budgets highlighted the need to upgrade provincial infrastructure including the water, wastewater and storm water system. In September 2016, the Government of Canada announced the Clean Water and Wastewater Fund. The Fund is a bilateral agreement between the federal and provincial governments that opened the way for $2B in combined funding for municipalities across the province. More than 80% of Ontario residents get their drinking water from municipal residential drinking water systems.
Several projects are underway throughout Ontario to replace aging water infrastructure, expand access, and train certified operators. A major part of the infrastructure rollout is to help eliminate long-term drinking water advisories and provide a reliable source of clean drinking water to First Nation communities. Recently, the provincial government announced an investment of about $970M in 54 water infrastructure projects across 60 municipalities in Ontario as of April 2024.
Graph 2. Sector Employment, Sector GDP, Electric Power Selling Price

Source: Statistics Canada, Labour Force Survey, Custom Table
*Data are expressed as index where year 2013 = 100%
Show graphic in plain text
EMPLOYMENT OUTLOOKS
The outlook for Ontario‘s utilities industry continues to exhibt an upward trajectory for the 2024-2026 forecast period for workers. As Ontario makes the shift from fossil fuel energy production to renewable energy sources, there will be increased pressure on the power grid to meet significant growth in demand for electricity. The industry is in the midst of structural changes that will transform the power grid in Ontario over the coming years. By 2050, electricity is projected to account for 40 to 45% of Canada‘s energy mix, a significant increase from the current 18%.
Canada‘s energy labour force as a whole is growing at a steady rate and is expected to employ nearly 640,000 people by 2030. However, one concern for the utilities industry is its older workforce and the need to transfer expertise to younger individuals. A survey of employers in Canada‘s electricity sector revealed a significant age imbalance in the workforce, with nearly three times as many employees aged 55 or older compared to those aged 15 to 24. Further, competition with other sectors that require similar skills will impact the sector‘s ability to recruit the required talent. This will likely constrain future growth in output and sector employment.
The shift in the utilities industry from fossil fuels to clean energy sources is changing the way energy is generated, stored, and monitored. For example, the provincial government has established a fund that will invest $15 million to develop opportunities for hydrogen to be integretated into Ontario‘s clean electricty system, including hydrogen storage. OPG is also working with local Indigenous communities to explore new hydroelectric development opportunities in Northern Ontario. The University of Windsor is partnering with the Ontario Greenhouse Vegetable Growers and Kruger Energy to investigate using wind turbines to power and heat greenhouses in Southwestern Ontario.
In addition, GE Hitachi, a North Carolina-based nuclear energy company, along with SNC-Lavalin, Aecon and OPG will build Canada‘s first small modular reactor (SMR) in Darlington with construction to be compled by late 2028 and support of $970 million from the Canada Infrastructure Bank. As well, the federal government has invested $27.2 million in Westinghouse Electric Canada so its next-generation SMR, the eVinci micro-reactor, can be successfully licensed in Canada.
GE Hitachi will also support BWXT Canada in helping build key components in Ontario for small modular reactors (SMRs) for use in Poland, with a $1.0 billion contract. These SMRs are considered the future of the nuclear energy sector, due to the smaller footprints and shorter construction schedules than traditional nuclear generating stations. As of March 2022, the governments of Ontario, Saskatchewan, New Brunswick and Alberta agreed to a joint strategic plan outlining the path forward on SMRs.
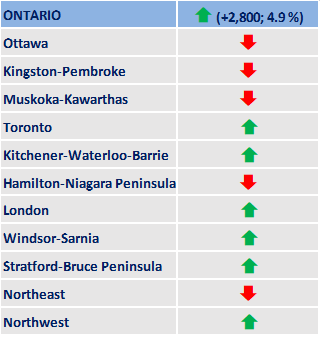
Table 3. Employment Change in Utilities: July 2019 to 2024
Source: Statistics Canada, Labour Force Survey, Custom Table
Show graphic in plain text
Key trends affecting the outlook of the utilities sector
- An overall movement towards decarbonization, electrification, and the adoption of renewable energy.
- Major investments in clean energy, including new nuclear generating stations, new transmission, new pumped hydroelectric storage, and other infrastructure needed to maintain and build clean electricity ecosystem.
- Skilled talent shortages in the clean energy sector.
FOR FURTHER INFORMATION
Note: In preparing this document, the authors have taken care to provide clients with labour market information that is timely and accurate at the time of publication. Since labour market conditions are dynamic, some of the information presented here may have changed since this document was published. Users are encouraged to also refer to other sources for additional information on the local economy and labour market. Information contained in this document does not necessarily reflect official policies of Employment and Social Development Canada.
Prepared by: Labour Market and Socio-economic Information Directorate, Service Canada, Ontario Region
For further information, please contact LMSID at: Contact: Labour Market Information - Canada.ca (services.gc.ca)
APPENDIX
Table A1. Geographical Distribution of the Sector
Source: Statistics Canada, Labour Force Survey, Custom Table
Show graphic in plain text
Table A2. Characteristics of Employed Persons
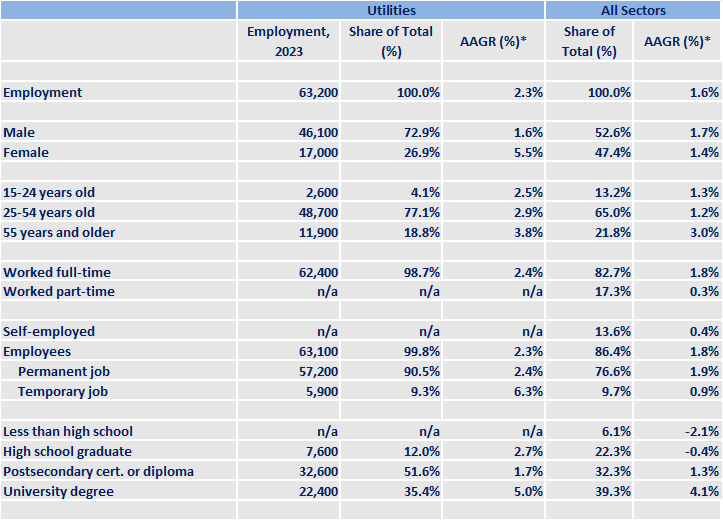
Source: Statistics Canada, Labour Force Survey, Custom Table
*Average annual growth rate for last ten years available data
Show table in plain text
| Utilities | All Sectors | |||||
|---|---|---|---|---|---|---|
| Employment, 2023 | Share of Total (%) | AAGR (%)* | Share of Total (%) | AAGR (%)* | ||
| Employment | 63,200 | 100.0% | 2.3% | 100.0% | 1.6% | |
| Male | 46,100 | 72.9% | 1.6% | 52.6% | 1.7% | |
| Female | 17,000 | 26.9% | 5.5% | 47.4% | 1.4% | |
| 15-24 years old | 2,600 | 4.1% | 2.5% | 13.2% | 1.3% | |
| 25-54 years old | 48,700 | 77.1% | 2.9% | 65.0% | 1.2% | |
| 55 years and older | 11,900 | 18.8% | 3.8% | 21.8% | 3.0% | |
| Worked full-time | 62,400 | 98.7% | 2.4% | 82.7% | 1.8% | |
| Worked part-time | x | x | x | 17.3% | 0.3% | |
| Self-employed | x | x | x | 13.6% | 0.4% | |
| Employees | 63,100 | 99.8% | 2.3% | 86.4% | 1.8% | |
| Permanent job | 57,200 | 90.5% | 2.4% | 76.6% | 1.9% | |
| Temporary job | 5,900 | 9.3% | 6.3% | 9.7% | 0.9% | |
| Less than high school | x | x | x | 6.1% | -2.1% | |
| High school graduate | 7,600 | 12.0% | 2.7% | 22.3% | -0.4% | |
| Postsecondary cert. or diploma | 32,600 | 51.6% | 1.7% | 32.3% | 1.3% | |
| University degree | 22,400 | 35.4% | 5.0% | 39.3% | 4.1% | |