
Economic Scan - Ontario: 2024
Demographics

Highlights
- 16.2 million people lived in Ontario in 2024, an increase of 2.2% from 2023. Ontario represents 39.0% of Canada’s total population
- The proportion of seniors aged 65+ is projected to increase from 18.3% in 2024 to 22.4% in 2034.
- In 2024, individuals aged 55-64 accounted 18.9% of the working-age population (aged 15-64). By 2034, that proportion could fall to 16.8%.
- The proportion of youth (15-29) is projected to decline from 20.9% in 2024 to 19.3% in 2034.
- Labour force participation has risen amongst workers aged 65 and over in recent years as the cost of living has increased.
The Indigenous population accounted for 2.2% of the Ontario labour force as of 2024.
Ontario has the largest proportion of recent immigrants arriving in Canada, with 44.0% of recent immigrants who arrived between 2016 and 2021. In 2024, Canada welcomed 483,390 new permanent residents, an increase of 2.5% compared to the previous year, as about 42.6% settled in Ontario. Immigration, Refugees and Citizenship Canada has set a goal of about 395,000 new permanent residents for 2025, a decrease of 18.6% from 2024.
The official-language minority community in Ontario represented 4.1% of the provincial population (2021 Census) and is prevalent mostly in the Northeast and Ottawa economic regions.
In 2022, 28.0% of the Ontario population aged 15 and over were persons with disabilities. The 2022 Canadian Survey on Disability revealed that persons with disabilities are more likely to be employed in Canada than in the past
Labour Market Conditions
Ontario in 2024...
Employment continued to make gains (+1.7%)
Unemployment rose (+27.4%)
Participation rate remained stable (65.6% to 65.3%)
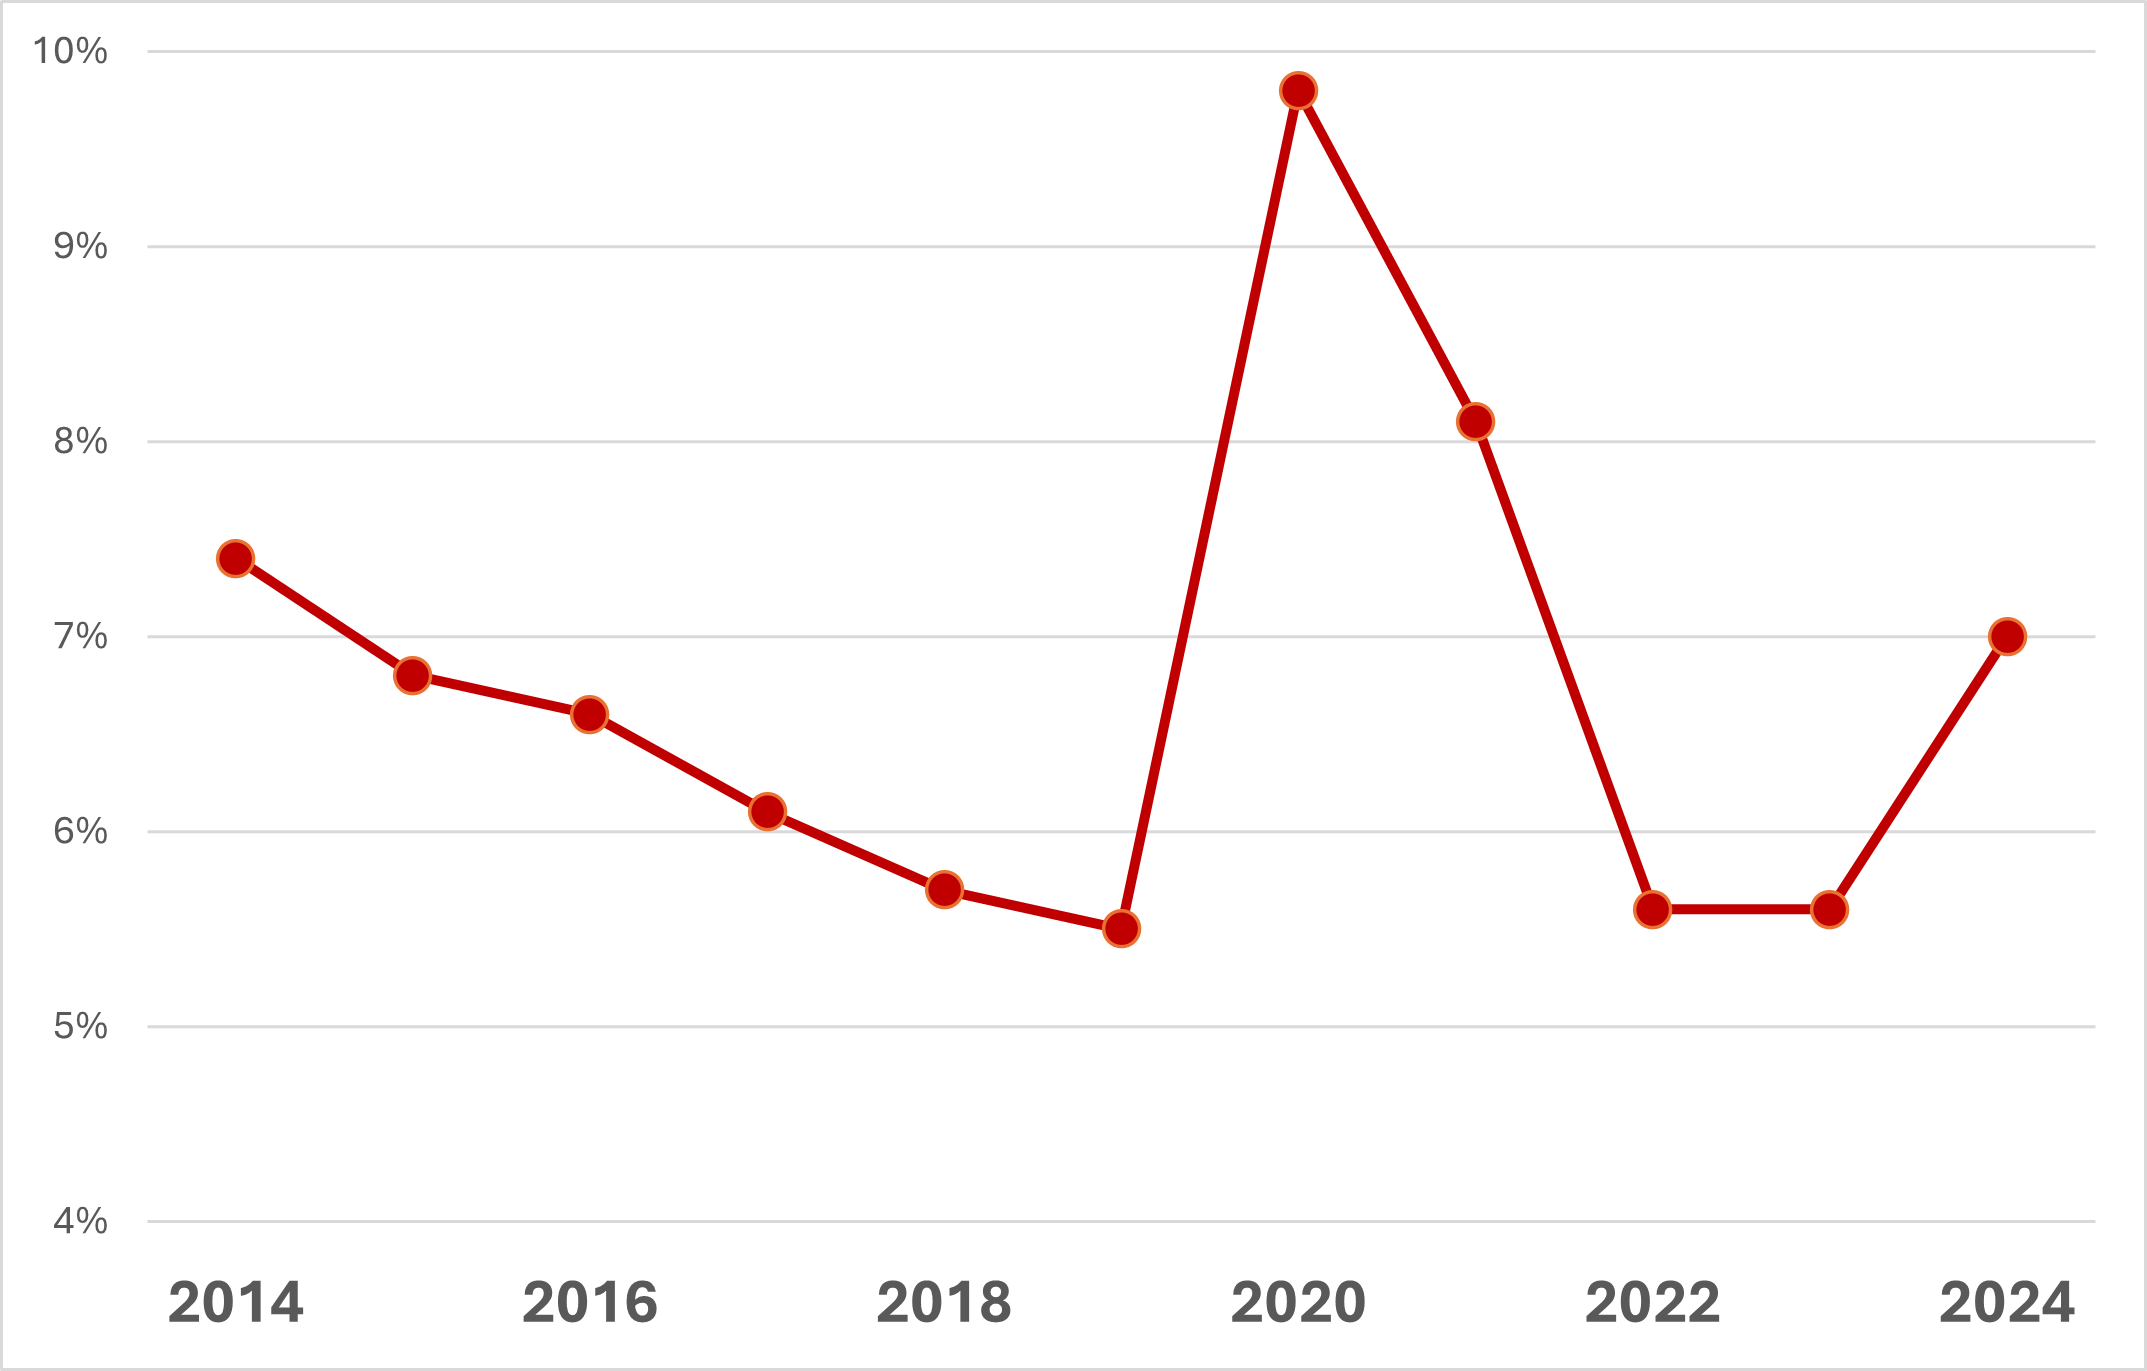
Unemployment rate increased (5.6% to 7.0%)
Show data table:
| Year | Unemployment Rate(%) |
|---|---|
| 2014 | 7.4 |
| 2015 | 6.8 |
| 2016 | 6.6 |
| 2017 | 6.1 |
| 2018 | 5.7 |
| 2019 | 5.5 |
| 2020 | 9.8 |
| 2021 | 8.1 |
| 2022 | 5.6 |
| 2023 | 5.6 |
| 2024 | 7.0 |
- The provincial economy should continue to see a decline in inflation and interest rates from 2021 highs. Due to economic uncertainty, minimal growth is forecasted for employment in Ontario in 2025 and 2026
- The unemployment rate in Ontario is projected to rise to about 6.8 - 7.5% in 2025
Economic Conditions
Ontario’s Economic Factors in 2024
Falling interest rates
Weaker employment gains
Elevated unemployment levels

Source: The Government of Ontario. 2025 Ontario Budget.
Show data table:
| Year | Real GDP Projected Growth Rate |
|---|---|
| 2024 | 1.5% |
| 2025 | 0.8% |
| 2026 | 1.0% |
| 2027 | 1.9% |
- The Ontario economy continued to be resilient, avoiding a significant contraction in 2024.
- Ontario inflation was maintained within the 1.0% - 3.0% target range of the Bank of Canada.
- The Ontario’s real GDP is estimated to have grown by about 0.9% - 1.5% in 2024. The GDP is expected to continue modestly grow in 2025, with forecasts suggesting increases between 0.4% - 2.1%
Risks to the Ontario Economy in 2025
- Ontario continues to face challenges arising from tariffs from the U.S., affordability pressures, and weak employment gains.
- Recent changes to Canada’s immigration policies and targets may affect the economic outlook for Ontario. Lower levels of immigration and an aging population will likely slow down economic momentum in Ontario.
Regional Issues
Wages and Low-income populations
About 10.1% of Ontario’s population were in low-income status, according to the 2021 Census. The prevalence of low-income was especially high for those living alone, and those living in a single-parent household.
Average wages went up by 5.2% in 2024, higher than the Ontario inflation rate of 2.4%.
Small-Medium Enterprises (SMEs)
Small enterprises (1-99 employees) represented 97.9% of businesses with at least one employee in Ontario and employed 35.9% of employees in Ontario as of June 2024.
Medium-sized enterprises (100-499 employees) represented 1.8% of businesses with at least one employee in Ontario and employed 15.7% of employees in Ontario as of June 2024.
Large enterprises (500+ employees) represented 0.3% of businesses with at least one employee in Ontario and employed 47.6% of employees in Ontario as of June 2024
Industry Trends
Show data table
| Industry (NAICS) | Employment Change ('000s) |
|---|---|
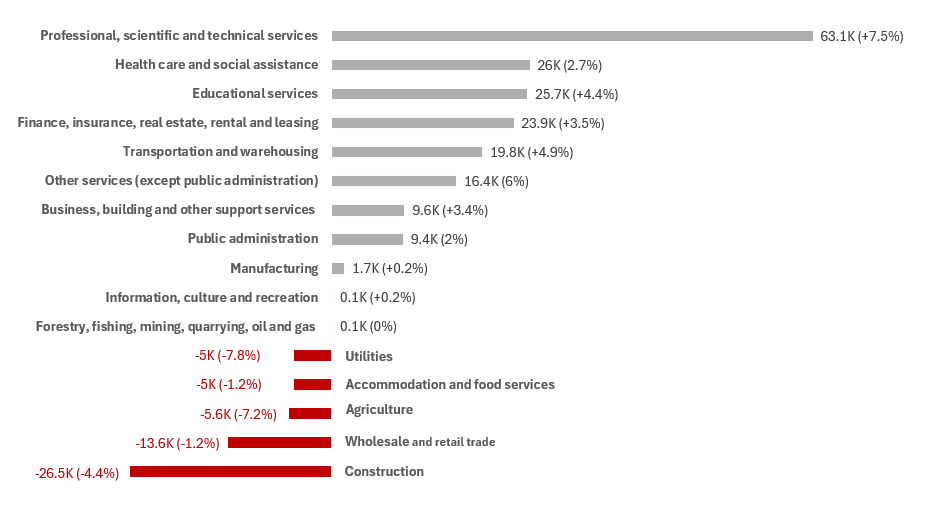
| Professional, scientific and technical services | 63.1 |
| Health care and social assistance | 26.0 |
| Educational services | 25.7 |
| Finance, insurance, real estate, rental and leasing | 23.9 |
| Transportation and warehousing | 19.8 |
| Other services (except public administration) | 16.4 |
| Business, building and other support services | 9.6 |
| Public administration | 9.4 |
| Manufacturing | 1.7 |
| Forestry, fishing, mining, quarrying, oil and gas | 0.1 |
| Information, culture and recreation | 0.1 |
| Utilities | -5.0 |
| Accommodation and food services | -5.0 |
| Agriculture | -5.6 |
| Wholesale and retail trade | -13.6 |
| Construction | -26.5 |
- Employment declined in the goods-producing sector (-2.2%) and increased in the services-producing (+2.7%) sector in 2024 in Ontario.
- Real estate and rental and leasing (+8.7%), professional, scientific and technical services (+7.5%) and other services (except public administration) (+6.0%) had the highest employment growth among sectors in Ontario.
- Utilities (-7.8%), agriculture (-7.2%) and construction (-4.4%) observed the highest losses in employment in 2024.
Regional Economic Conditions
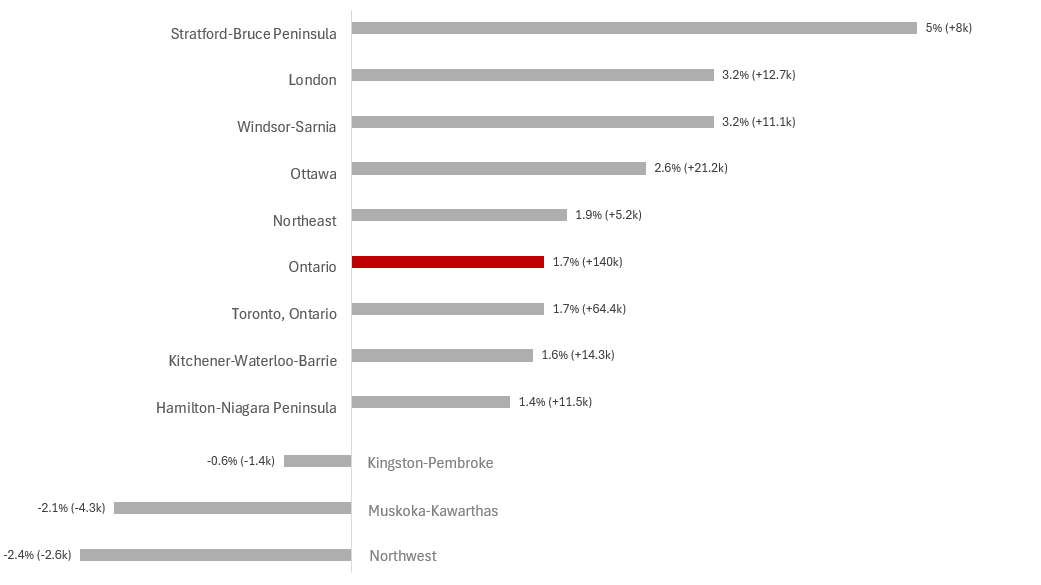
- Employment levels grew in eight of eleven economic regions in Ontario in 2024.
- Stratford-Bruce Peninsula (+5.0%), Windsor-Sarnia (+3.2%) and London (+3.2%) observed the highest employment growth in Ontario.
- Employment fell the in the Northwest (-2.4%), Muskoka-Kawarthas (-2.1%) and Kingston-Pembroke (-0.6%) economic regions.
Show data table
| Region | Employment Change (% and 000s) |
|---|---|
| Stratford-Bruce Peninsula | 5.0% (8.0) |
| London | 3.2% (12.7) |
| Windsor-Sarnia | 3.2% (11.1) |
| Ottawa | 2.6% (21.2) |
| Northeast | 1.9% (5.2) |
| Ontario | 1.7% (140) |
| Toronto | 1.7% (64.4) |
| Kitchener-Waterloo-Barrie | 1.6% (14.3) |
| Hamilton-Niagara Peninsula | 1.4% (11.5) |
| Kingston-Pembroke | -0.6% (-1.4) |
| Muskoka-Kawarthas | -2.1% (-4.3) |
| Northwest | -2.4% (-2.6) |
- Date modified: