
Information and Cultural Industries (NAICS 51): Ontario, 2024–2026
HIGHLIGHTS
- There were 154,700 people employed in the information and cultural industries in Ontario, comprising 2.0% of Ontario‘s total workforce in 2023.
- Employment in Ontario‘s information and cultural industries sector declined by 0.3% in 2023.
- Employment is expected to remain steady over the 2024-2026 forecast period.
ABOUT THE SECTOR
Composition and importance of the sector
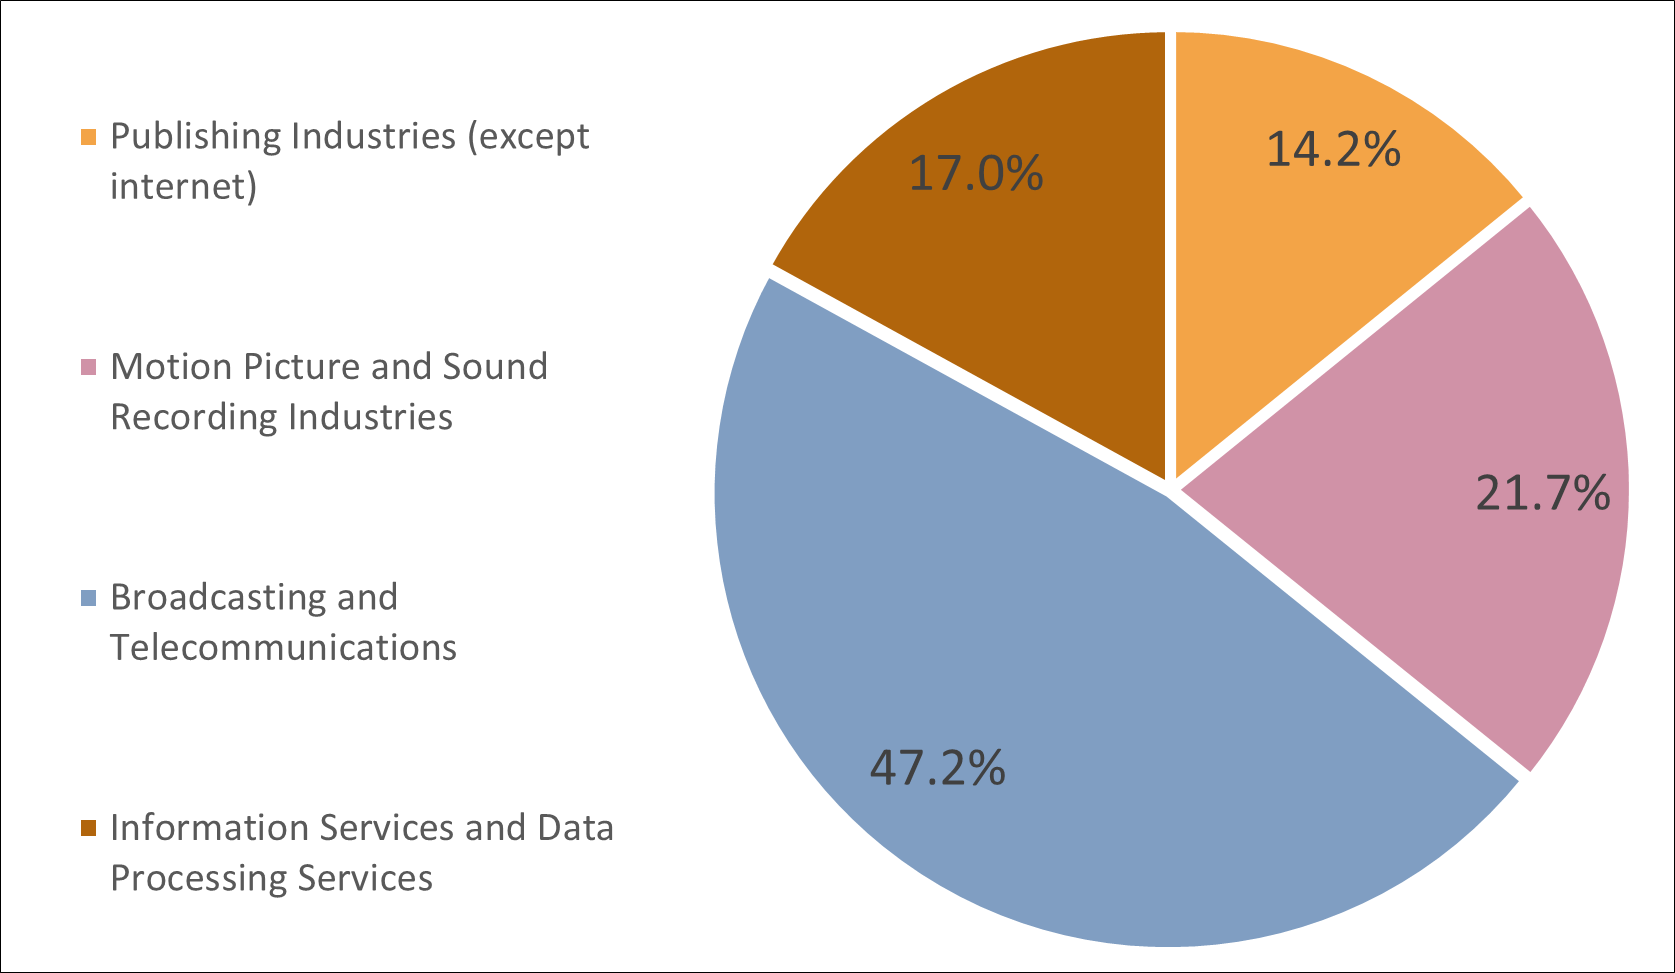
The information and cultural industries are comprised of four key subsectors:
- Motion picture and sound recording industries
- Publishing industries
- Telecommunications, and broadcasting and content providers
- Information services and computing infrastructure and data processing services
In Ontario, this sector employed 154,700 people in 2023. While this was only 2.0% of the province‘s total workforce, these workers accounted for 39.8% of the employment in information and cultural industries across the country.
Information and cultural industries in Ontario produced $37.5 billion in GDP in 2023 (4.3% of the province‘s total GDP). GDP grew 1.3% (+$491.4 million) from 2022.
Graph 1. Employment Share by Subsector
Source: Statistics Canada, Labour Force Survey, Custom Table
Show graphic in plain text
Geographical distribution of employment
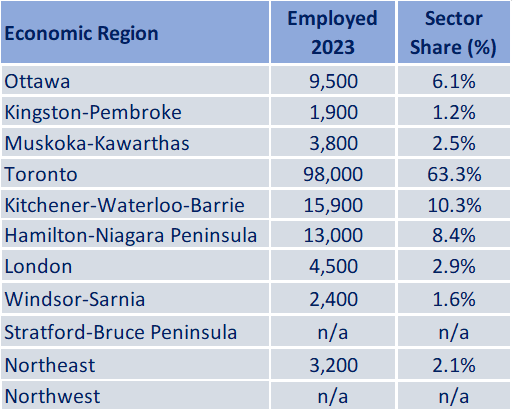
The Toronto economic region (ER) had the highest proportion of Ontario‘s workers in information and cultural industries as of 2023, with 63.3% of employment. This is due to Toronto‘s role in the province as a cultural and economic hub and the high population density in the region.
Information and cultural industries workers were over-represented in Toronto. In the Toronto ER, 2.6% of the total workforce was employed in the sector, compared to 1.9% of overall employment for the whole province.
Table 1. Employment by Economic Region
Source: Statistics Canada, Labour Force Survey, Custom Table
Show table in plain text
WORKFORCE
Workforce characteristics
- Nearly half (49.4%) of the sector‘s employees had a university degree in 2023, compared to 39.3% of the total provincial workforce.
- Women accounted for 39.0% of Ontario‘s information and cultural industries employees in 2023, compared to 47.4% for all industries.
- The sector in Ontario had a lower prevalence of part-time roles (11.8%) compared to the overall workforce in the province (17.3%).
- The average hourly wage of workers in the information and cultural industries sector in Ontario was $35.33 in 2023. This was higher than the provincial average of $29.18 amongst all sectors.
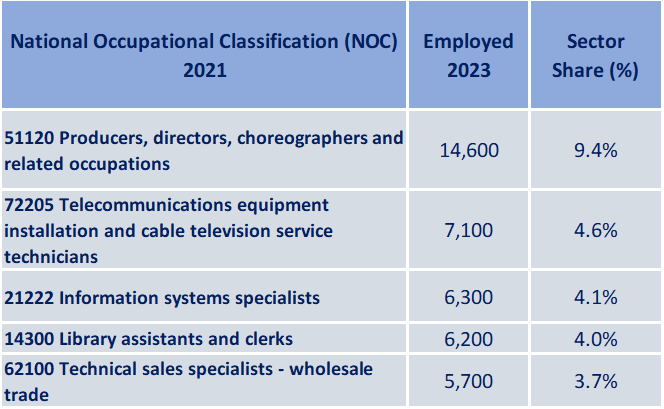
Table 2. Top 5 Occupations
Source: Statistics Canada, Labour Force Survey, Custom Table
Show table in plain text
RECENT HISTORY
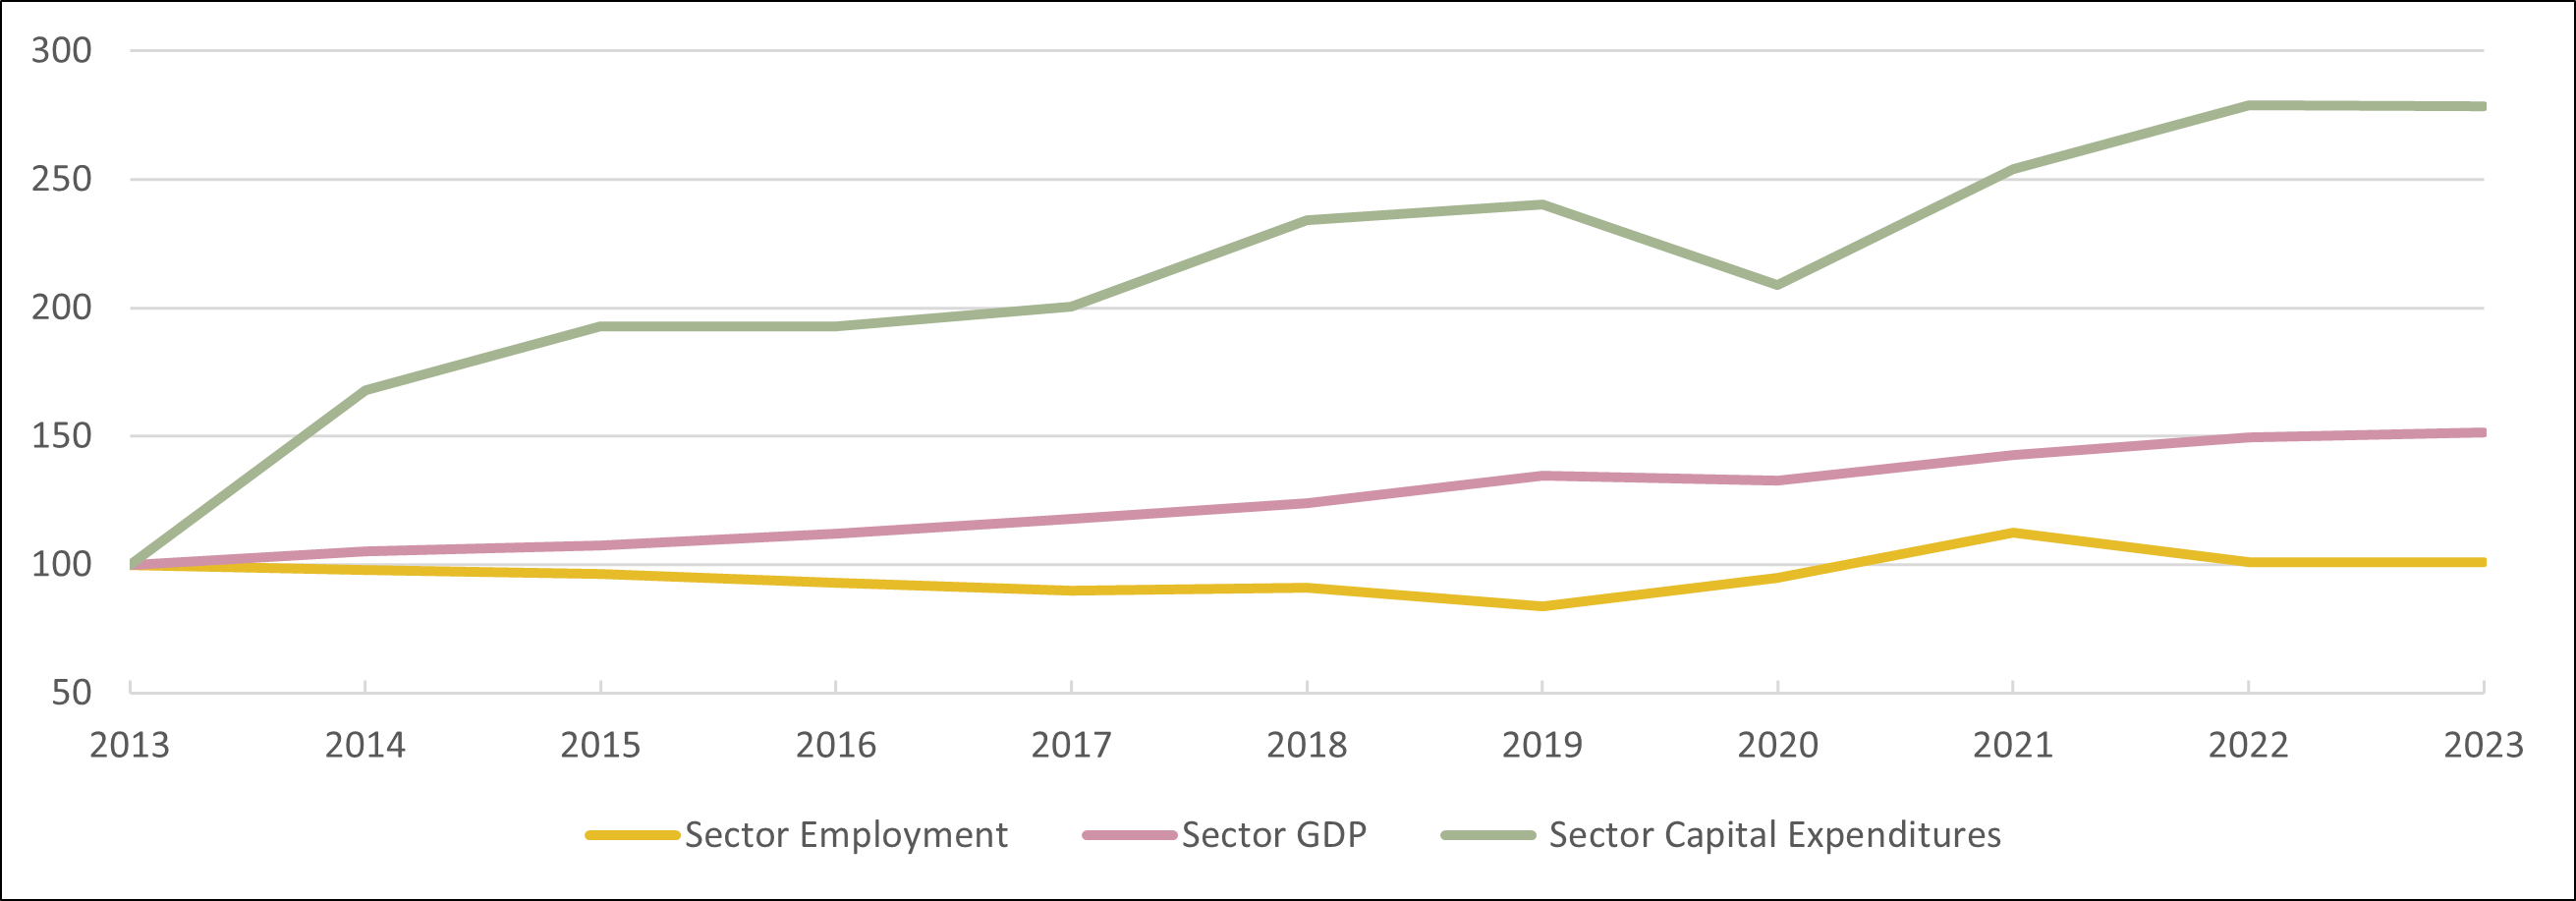
Employment in Ontario‘s information and cultural industries sector experienced a steady decline between 2013 and 2019. However, in contrast to most sectors, employment increased throughout the COVID-19 pandemic, before declining slightly in 2023. In July 2019, pre-pandemic, there were 135,500 individuals working in the sector; five years later, in July 2024, employment increased by 6.5% to 144,300.
Publishing industries: In Ontario, employment in publishing industries remained stable from 2013 to 2022, before declining significantly in 2023 (-9,900; -30.9%). This sub-sector comprises of two industry subgroups: software and print publishing.
Beginning in 2022, the software publisher‘s industry group was impacted by the global slowdown in the technology sector as numerous companies (including Canadian-based firms such as Shopify and WealthSimple) announced layoffs. The technology slowdown can be attributed to a correction from over-hiring during the pandemic, a slowing economy, and decreased consumer spending.
Furthermore, newspaper and book publishers have struggled in recent history. Since 2013, employment has been steadily declining – contracting by more than half by 2021. In 2023, Metroland Media Group announced it would cut 600 jobs at regional papers and Nordstar planned to stop printing most of its community newspapers across the province. Some of the main challenges identified for newspaper and book publishers were the rising costs of paper and strong competition for readers and advertising dollars from alternative sources.
Broadcasting and telecommunications: Like the sector overall, employment in the broadcasting and telecommunications subsector had been in decline up until 2019 before rebounding during the pandemic (from 52,400 in 2019 to 74,800 in 2021; +42.7%). After declining again in 2022, employment increased by 9.3% in 2023 (+2,200 jobs). Operating revenues for radio and television broadcasting in Canada, however, had already been trending downwards prior to the pandemic and continued to fall in 2023 (-18.7% and -6.9% respectively, from 2019). The subsector has been experiencing layoffs as advertising revenues decline, with Corus Entertainment announcing a 25% cut in their workforce, and numerous layoffs at CBC/Radio Canada.
Information services and data processing services: Employment in the information services and data processing services subsector increased by 4.0%, adding 1,000 jobs in 2023. The demand for data processing and hosting services has increased as businesses continue to outsource information technology needs to enhance data efficiency. In 2023, computing infrastructure providers, data processing, web hosting, and related services experienced a 14.6% growth in revenue. As well, the number of paid employees in this subsector has increased by 57.1% since 2019.
Graph 2. Sector Employment, Sector GDP, and Sector Capital Expenditures in Ontario*
Sources: Statistics Canada, Labour Force Survey, Custom Table
Statistics Canada, Gross Domestic Product by Industry - Provincial and Territorial (Annual)
Statistics Canada, Provincial and Territorial Gross Domestic Product by Income and by Expenditure Accounts
*Data are expressed as index where year 2013 = 100%
Show graphic in plain text
EMPLOYMENT OUTLOOKS
Over the 2024-2026 forecast period, employment in Ontario‘s information and cultural industries is expected to remain steady. The degree of employment growth is subject to the various pressures faced by each unique subsector.
Overall, trends towards digital content platforms and demand for internet services should support growth in this industry. Demand for employment may continue into the near future as telecommunications companies and governments invest in expanding Ontario‘s broadband infrastructure to expand into rural and remote areas. Broadband expansion projects include a $97 million joint federal and provincial investment for ROCK Networks, which will bring high-speed internet access to more than 60 communities along the north shore of Lake Huron.
In contrast, employment growth forecasts for software publishers may be softened by the global slowdown in the technology industry. Additionally, elevated interest rates are increasing the cost of borrowing for firms and may also lead to reduced consumer spending on products and services.
Furthermore, traditional book and newspaper print publishing is expected to further decline throughout the forecast period. Various factors are contributing to the ongoing challenges within the sector, such as market saturation, changing reader habits, and digital transformation.
Table 3. Employment Change in Information and Cultural Industries: July 2019 vs. July 2024
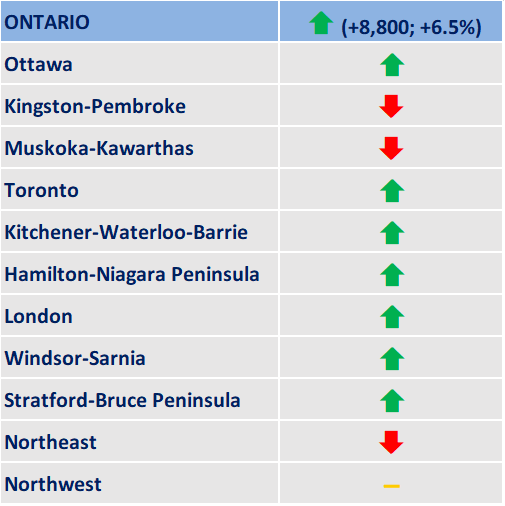
Source: Statistics Canada, Labour Force Survey, Custom Table
Show graphic in plain text
Key trends affecting the outlook of the information and cultural industries sector
- Increased demand for better internet connection and speed, particularly in rural and remote areas
- Continued slowdown in the global technology sector
- Continued decline in traditional print and visual media
FOR FURTHER INFORMATION
Note: In preparing this document, the authors have taken care to provide clients with labour market information that is timely and accurate at the time of publication. Since labour market conditions are dynamic, some of the information presented here may have changed since this document was published. Users are encouraged to also refer to other sources for additional information on the local economy and labour market. Information contained in this document does not necessarily reflect official policies of Employment and Social Development Canada.
Prepared by: Labour Market and Socio-economic Information Directorate, Service Canada, Ontario Region
For further information, please contact LMSID at: Contact: Labour Market Information - Canada.ca (services.gc.ca)
APPENDIX
Table A1. Geographical Distribution of the Sector
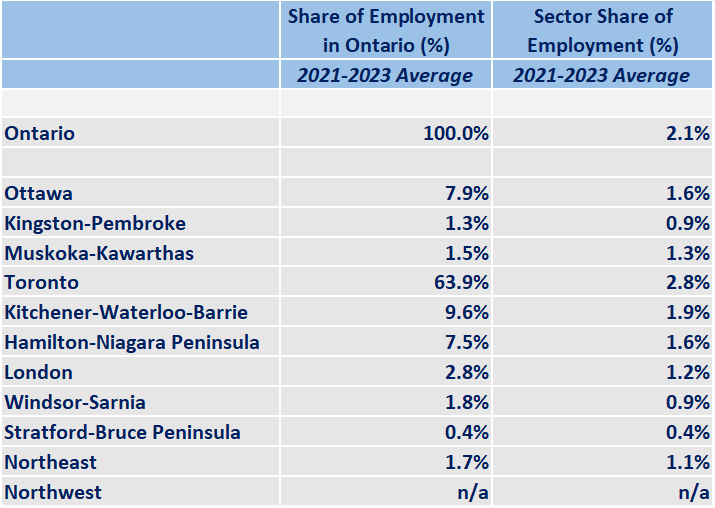
Source: Statistics Canada, Labour Force Survey, Custom Table
Show graphic in plain text
Table A2. Characteristics of Employed Persons
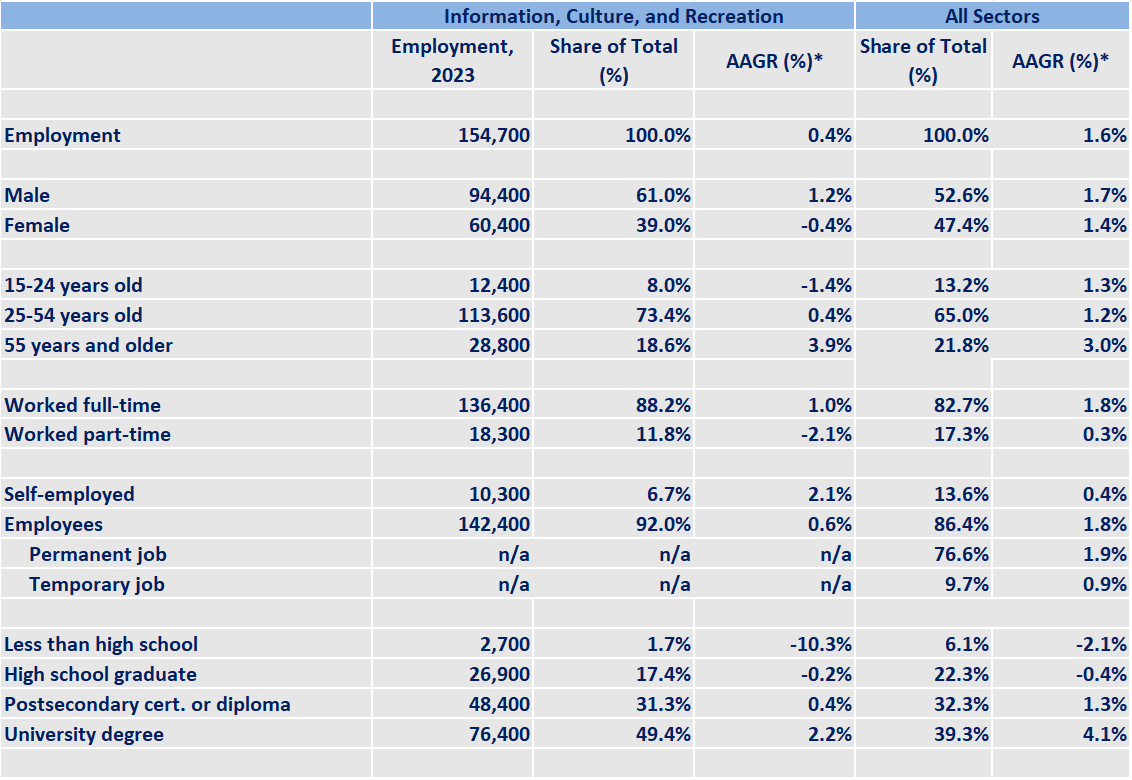
Source: Statistics Canada, Labour Force Survey, Custom Table
*Average annual growth rate for last ten years available data
Show table in plain text
| Information, Culture, and Recreation | All Sectors | |||||
|---|---|---|---|---|---|---|
| Employment, 2023 | Share of Total (%) | AAGR (%) * | Share of Total (%) | AAGR (%) * | ||
| Employment | 154,700 | 100.0% | 0.4% | 100.0% | 1.6% | |
| Male | 94,400 | 61.0% | 1.2% | 52.6% | 1.7% | |
| Female | 60,400 | 39.0% | -0.4% | 47.4% | 1.4% | |
| 15-24 years old | 12,400 | 8.0% | -1.4% | 13.2% | 1.3% | |
| 25-54 years old | 113,600 | 73.4% | 0.4% | 65.0% | 1.2% | |
| 55 years and older | 28,800 | 18.6% | 3.9% | 21.8% | 3.0% | |
| Worked full-time | 136,400 | 88.2% | 1.0% | 82.7% | 1.8% | |
| Worked part-time | 18,300 | 11.8% | -2.1% | 17.3% | 0.3% | |
| Self-employed | 10,300 | 6.7% | 2.1% | 13.6% | 0.4% | |
| Employees | 142,400 | 92.0% | 0.6% | 86.4% | 1.8% | |
| Permanent job | n/a | n/a | n/a | 76.6% | 1.9% | |
| Temporary job | n/a | n/a | n/a | 9.7% | 0.9% | |
| Less than high school | 2,700 | 1.7% | -10.3% | 6.1% | -2.1% | |
| High school graduate | 26,900 | 17.4% | -0.2% | 22.3% | -0.4% | |
| Postsecondary cert. or diploma | 48,400 | 31.3% | 0.4% | 32.3% | 1.3% | |
| University degree | 76,400 | 49.4% | 2.2% | 39.3% | 4.1% | |