
Machinery Manufacturing (NAICS 333): Ontario, 2024-2026
HIGHLIGHTS
- Ontario is at the core of Canada‘s machinery manufacturing industry; it is home to almost half of the businesses and employees in the industry‘s national workforce.
- In 2023, the machinery manufacturing industry employed 58,400 workers in Ontario, about 0.7% of total provincial employment.
- Employment in Ontario's machinery manufacturing industry decreased by 9.9% in 2023, and remained below pre-pandemic levels.
- Moderate growth in the industry is expected from investments in key industries including non-residential construction, automotive manufacturing, natural resources, and agriculture.
ABOUT THE SECTOR
Composition and importance of the sector
Ontario‘s machinery manufacturing industry plays a vital role in providing inputs for various large industries. End users of machinery in Ontario include motor vehicle and parts manufacturing, construction, mining, agriculture, and power generation.
Employment in Canada‘s machinery manufacturing sector is concentrated in Ontario. In 2023, employment in Ontario‘s machinery manufacturing sector was recorded at 58,400, representing 40.6% of the industry‘s national workforce.
In 2023, machinery manufacturing accounted for 9.5% of the manufacturing industry‘s gross domestic product (GDP) in Ontario, increasing 6.0% from the previous year. Exports are a significant contributor to this industry‘s GDP. In 2023, machinery manufacturing made up 8.3% of Ontario‘s total exports, with over 81% of the machinery exports headed towards the United States.
Graph 1. Employment Share by Subsector
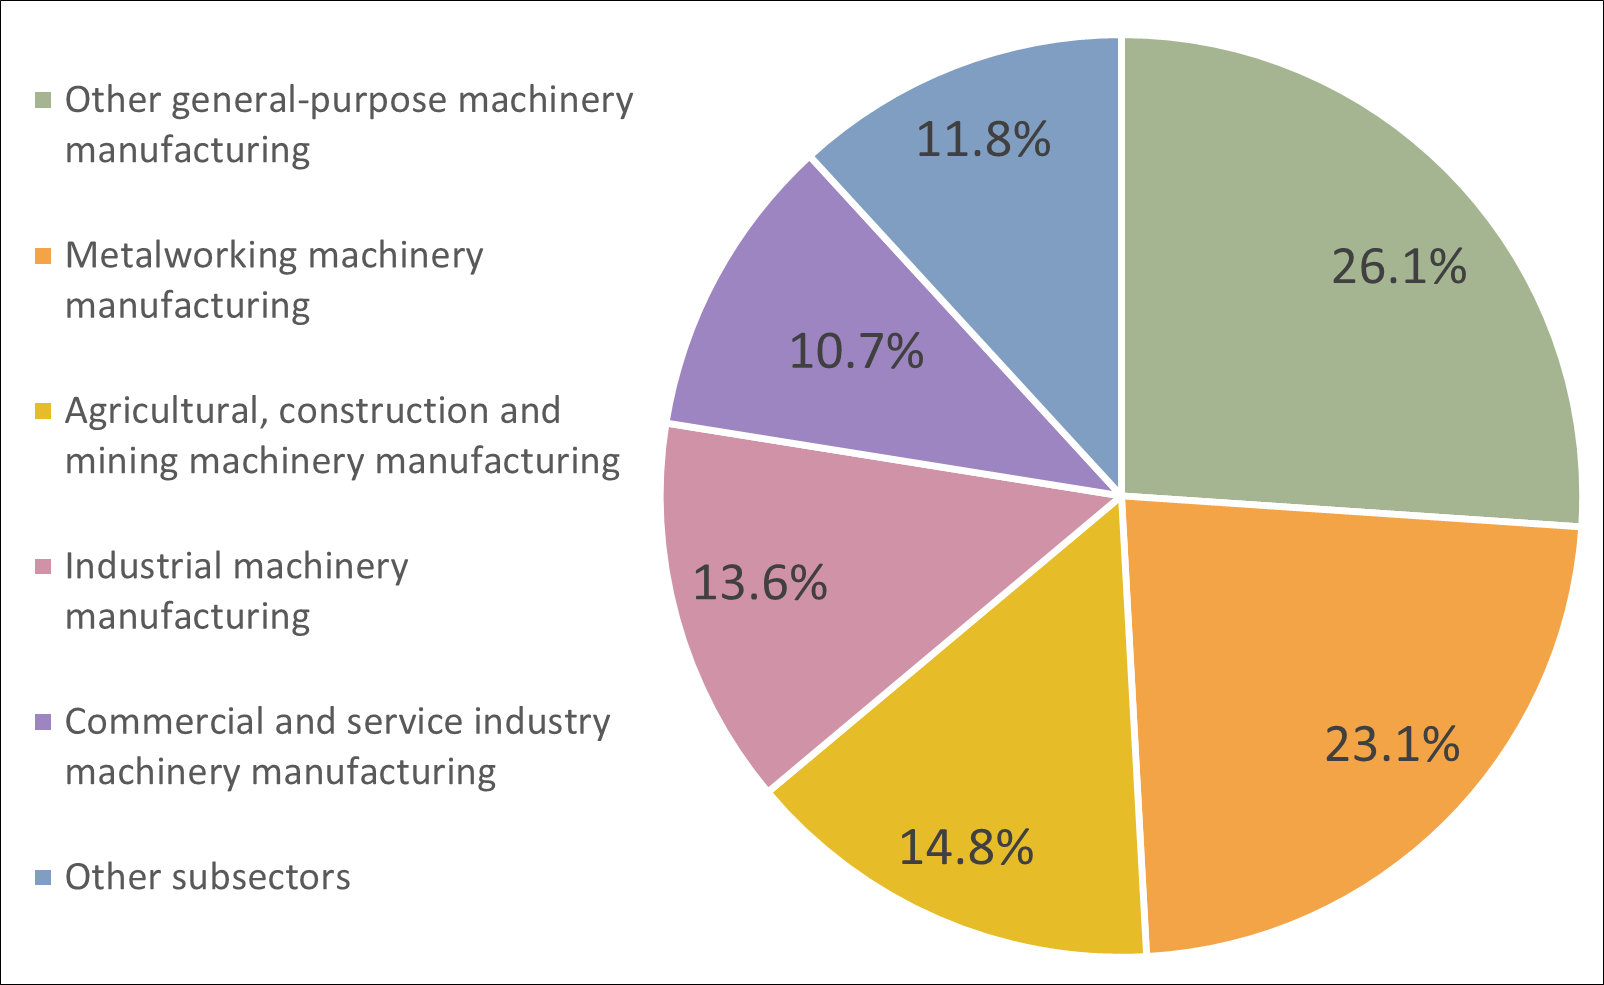
Sources: Statistics Canada, Labour Force Survey, Custom Table
Show graphic in plain text
Geographical distribution of employment
The machinery manufacturing sector in Ontario is concentrated in southern Ontario, where key suppliers and end users have a strong presence.
In 2023, the Toronto Economic Region (ER) had the highest proportion of workers employed in Ontario‘s machinery manufacturing at 33.4%, followed by Kitchener-Waterloo-Barrie (22.6%) and Windsor-Sarnia (12.3%).
Proportionally, employment was highest in the Windsor-Sarnia and Kitchener-Waterloo-Barrie economic regions (ERs), where machinery manufacturing accounted for 2.2% and 1.6% of total employment in the region, respectively, compared to 0.7% for Ontario as a whole. Similarly, machinery manufacturing was over-represented in the London ER (1.1% of total employment in the ER), Stratford-Bruce ER (1.0%) and Hamilton-Niagara Peninsula ER (0.9%).
Table 1. Employment by Economic Region
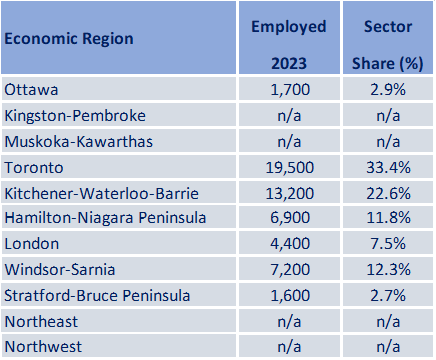
Source: Statistics Canada, Labour Force Survey, Custom Table
Show table in plain text
WORKFORCE
Workforce characteristics
- The average hourly earnings for machinery manufacturing in 2023 was $30.45, slighty lower than the average manufacturing hourly wage of $30.76 and higher than the provincial average hourly wage of $29.18.
- Males are over-represented in Ontario‘s machinery manufacturing industry, accounting for 80.0% of employment in 2023. By comparison, males accounted for about half of the provincial workforce in 2023.
- Older workers are more prevalent: in 2023, 31.2% of wokers in the industry were aged 55 and over, compared to 21.8% of workers across all industries provincially.
- 96.7% of the workers worked full-time in 2023, significantly higher than the proportion of full-time workers in the total provincial workforce (82.7%).
Table 2. Top 5 Occupations
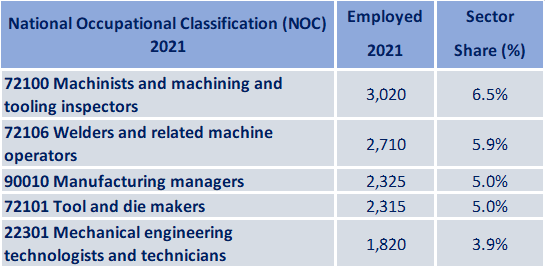
Sources: Statistics Canada, Census of Population, Custom Table
Show table in plain text
RECENT HISTORY
In 2023, employment in Ontario‘s machinery manufacturing sector decreased by 9.9% (-6,400), falling below pre-pandemic levels after having rebounded during 2021 and 2022 (61,900 in 2019 vs. 58,400 in 2023).
Ontario‘s machinery manufacturing GDP recorded a 6.0% annual increase in 2023, despite total manufacturing GDP remaining stable (+0.1%). Machinery manufacturing sales in the province were also up 12.1% in 2023, while total provincial manufacturing sales increased by 5.4%.
Over the last decade, labour and skills shortages and high material costs in this sector have prompted manufacturers to adopt new technologies to stay competitive, largely via investments in machinery and equipment. Many machinery manufacturing firms across Ontario expanded production capacity, including armoured vehicle maker Roshel Inc. in Brampton, Glider Guard Tool and Die Inc. in Tecumseh, and AAG Tailored Cutting Solutions in Hamilton, among others.
Recent growth in the machinery manufacturing sector has been supported by capital investments in the automotive industry to build capacity for electric vehicles,and the construction of new electric vehicle battery manufacturing plants. Furthermore, expansions in the aerospace and food manufacturing sectors, along with major nuclear refurbishment projects, have supported demand for machinery manufacturing products.
Graph 2. Sector Employment, Sector Sales and Sector Real Gross Domestic Product (GDP)
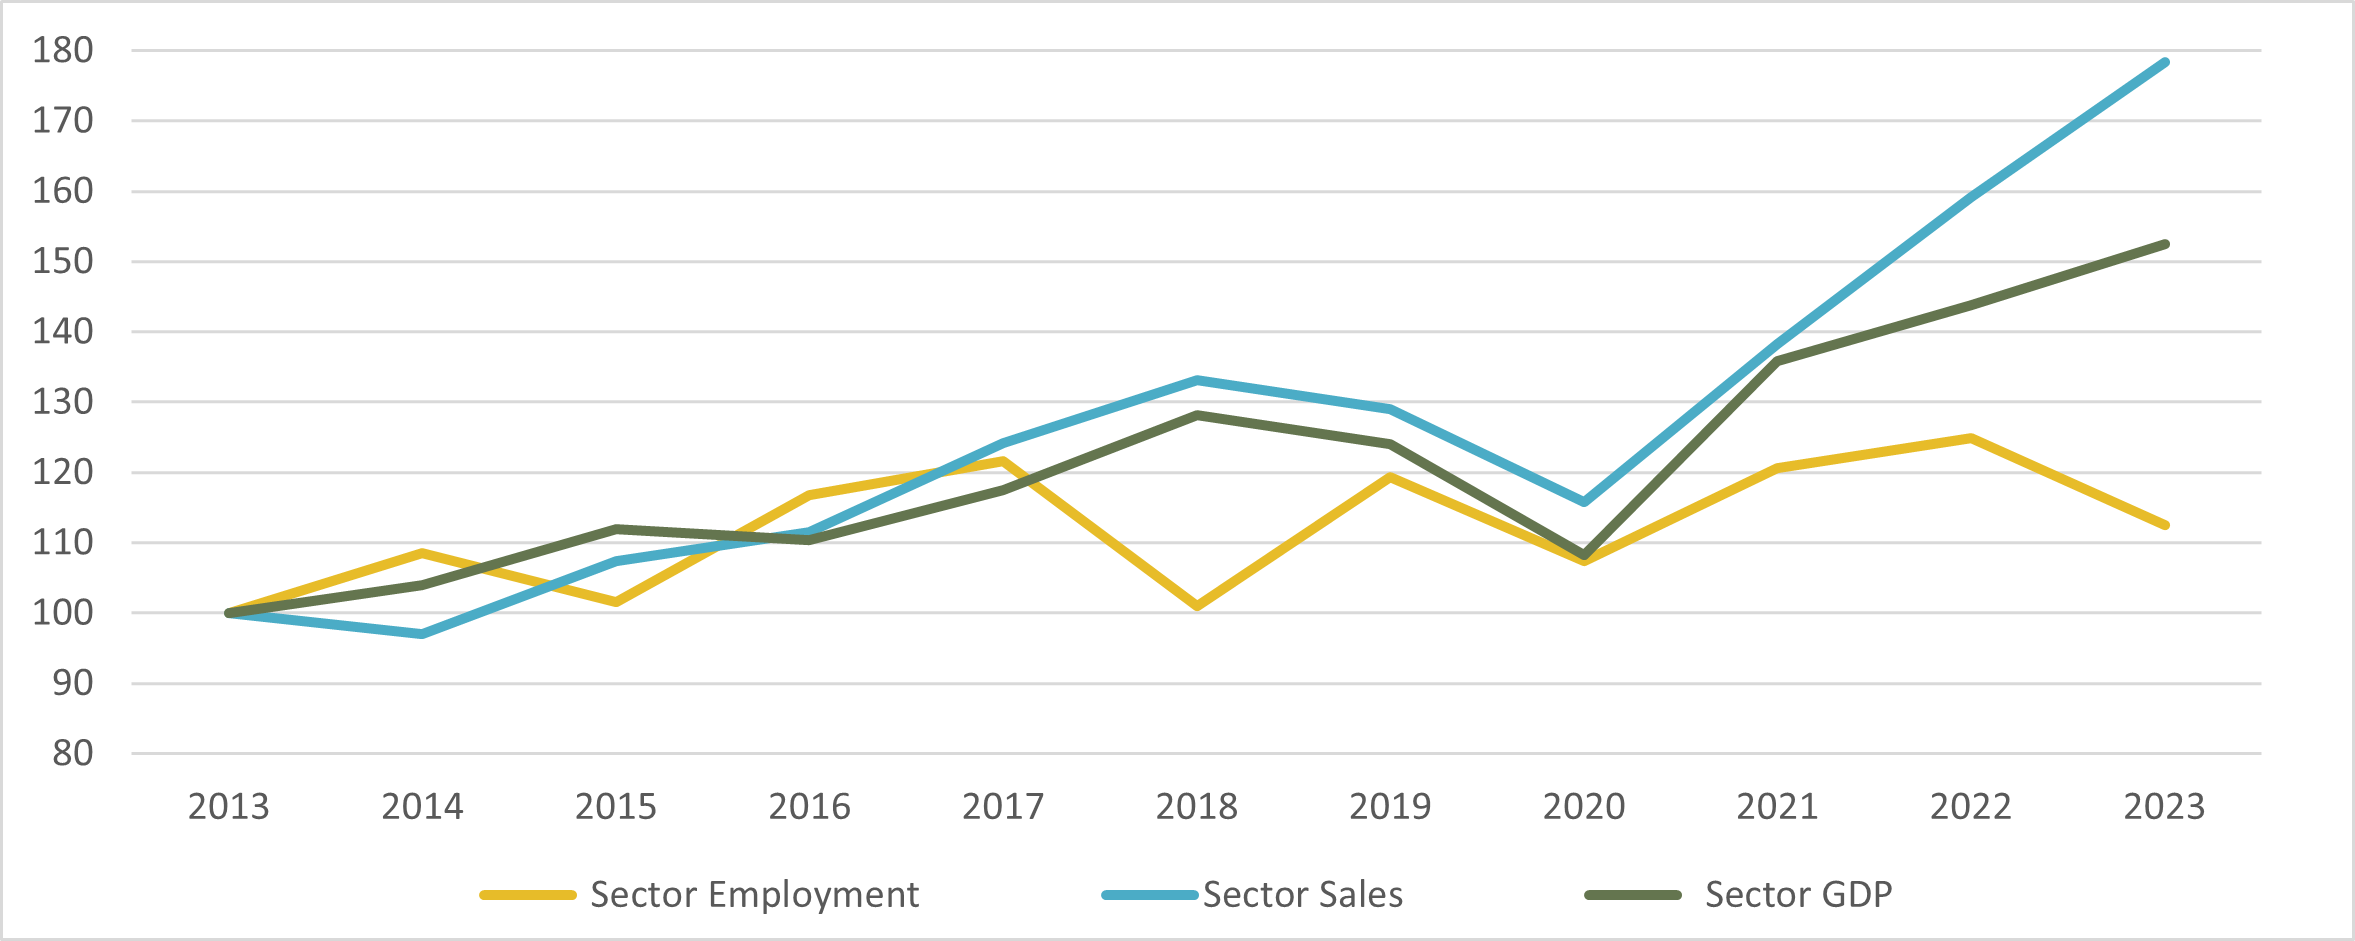
Sources: Statistics Canada, Custom Tables
*Data are expressed as index where year 2013 = 100%
Show graphic in plain text
EMPLOYMENT OUTLOOKS
Employment in the machinery manufacturing industry in Ontario is expected to see modest growth over the 2024 to 2026 period. However, various positive and negative factors impacting the industry will have varying effects on employment, creating uncertainty in the outlook.
Economic conditions in the U.S. will affect machinery manufacturing in Ontario, as the United States is the leading market for Ontario‘s machinery manufacturers. While Ontario‘s machinery manufacturing sales to the United States are negatively impacted by higher interest rates, the Canada-United States exchange rate will help increase exports for Ontario‘s machinery manufacturers as the loonie has lost value against the U.S. dollar, making Canadian machinery cheaper for American companies.
Domestically, the demand for machinery and equipment is expected to face both positive and negative pressures over the forecast period. Economic uncertainty and projections of mixed economic growth have made manufacturers cautious investing. However, lower interest rates should revive housing construction in the province, while also making financing for purchases of machinery and equipment less expensive. Moreover, the manufacturing industry in the province can benefit from comparatively subdued energy and raw material prices (relative to peak 2022 prices), supporting demand for machinery manufacturing products.
Despite an uncertain economic outlook, total capital expenditures on machinery and equipment are projected to grow by 10.4% to $46.4 billion in Ontario in 2024, based on preliminary projections. For example, Ontario‘s machinery manufacturers are expected to spend over $350 million on machinery and equipment in Ontario in 2024, which bodes well for the employment outlook.
The machinery manufacturing industry is facing similar skill and labour shortages as other manufacturing subindustries, as higher-skilled labour is required to meet for advanced manufacturing and to produce custom and higher-valued products. Industry reports suggest that companies are facing challenges recruiting workers, especially in machinery manufacturing-related skilled trades like machining, metal forming and shaping.
The industry‘s workforce is also aging, which has put more pressure on companies. Increased investment to train key skilled trades in Ontario‘s manufacturing sector will provide some growth in the sector‘s labour force.
The industry’s workforce is also aging, which has put more pressure on companies. Increased investment to train key skilled trades in Ontario’s manufacturing sector will provide some growth in the sector’s labour force.
Table 3. Employment Change in Machinery Manufacturing: July 2019 to July 2024
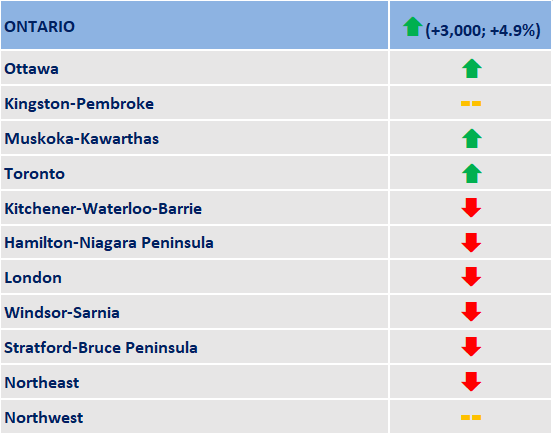
Sources: Statistics Canada, Labour Force Survey, Custom Table
Show graphic in plain text
Key trends affecting the outlook of the machinery manufacturing sector
- Overall mixed economic conditions moderating demand for machinery manufacturing products
- Large investments in non-residential construction, automotive manufacturing industry and nuclear refurbishment projects across the province
- Firms‘ investments in automation and expanding local production facilities
FOR FURTHER INFORMATION
Note: In preparing this document, the authors have taken care to provide clients with labour market information that is timely and accurate at the time of publication. Since labour market conditions are dynamic, some of the information presented here may have changed since this document was published. Users are encouraged to also refer to other sources for additional information on the local economy and labour market. Information contained in this document does not necessarily reflect official policies of Employment and Social Development Canada.
Prepared by: Labour Market and Socio-economic Information Directorate, Service Canada, Ontario Region
For further information, please contact LMSID at: Contact: Labour Market Information - Canada.ca (services.gc.ca)
APPENDIX
Table A1. Geographical Distribution of the Sector
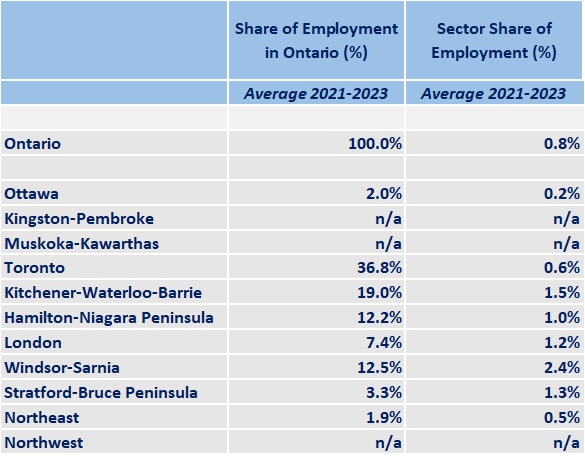
Source: Statistics Canada, Labour Force Survey, Custom Table
Show graphic in plain text
Table A2. Characteristics of Employed Persons
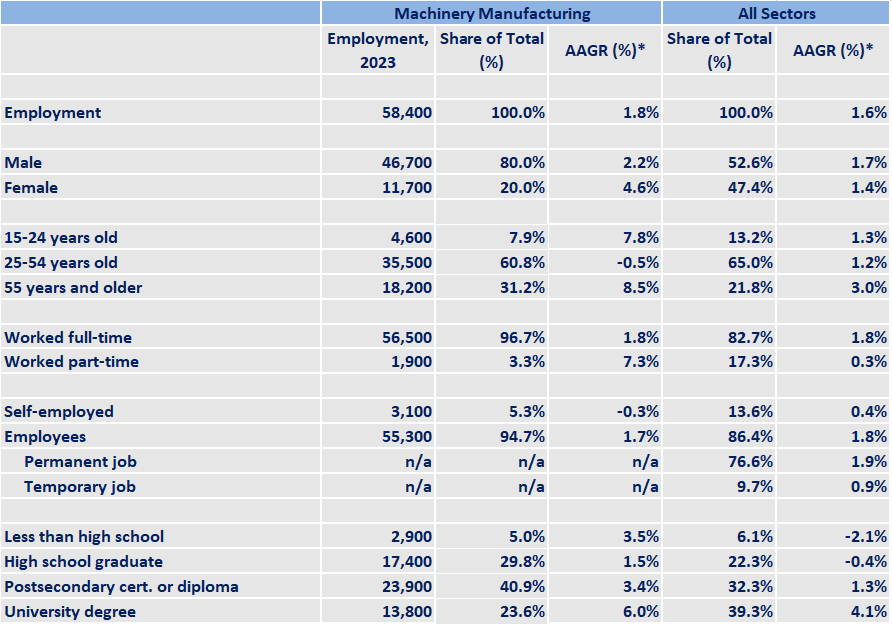
Sources: Statistics Canada, Labour Force Survey, Custom Tables
* Average annual growth rate for last ten years available data
Show table in plain text
| Machinery Manufacturing | All Sectors | |||||
|---|---|---|---|---|---|---|
| Employment, 2023 | Share of Total (%) | AAGR (%) * | Share of Total (%) | AAGR (%) * | ||
| Employment | 58,400 | 100.0% | 1.8% | 100.0% | 1.6% | |
| Male | 46,700 | 80.0% | 2.2% | 52.6% | 1.7% | |
| Female | 11,700 | 20.0% | 4.6% | 47.4% | 1.4% | |
| 15-24 years old | 4,600 | 7.9% | 7.8% | 13.2% | 1.3% | |
| 25-54 years old | 35,500 | 60.8% | -0.5% | 65.0% | 1.2% | |
| 55 years and older | 18,200 | 31.2% | 8.5% | 21.8% | 3.0% | |
| Worked full-time | 56,500 | 96.7% | 1.8% | 82.7% | 1.8% | |
| Worked part-time | 1,900 | 3.3% | 7.3% | 17.3% | 0.3% | |
| Self-employed | 3,100 | 5.3% | -0.3% | 13.6% | 0.4% | |
| Employees | 55,300 | 94.7% | 1.7% | 86.4% | 1.8% | |
| Permanent job | n/a | n/a | n/a | 76.6% | 1.9% | |
| Temporary job | n/a | n/a | n/a | 9.7% | 0.9% | |
| Less than high school | 2,900 | 5.0% | 3.5% | 6.1% | -2.1% | |
| High school graduate | 17,400 | 29.8% | 1.5% | 22.3% | -0.4% | |
| Postsecondary cert. or diploma | 23,900 | 40.9% | 3.4% | 32.3% | 1.3% | |
| University degree | 13,800 | 23.6% | 6.0% | 39.3% | 4.1% | |