
Mining, Quarrying, and Oil and Gas Extraction (NAICS 21): Ontario, 2024-2026
HIGHLIGHTS
- There were 35,300 people employed in Ontario‘s mining, quarrying, and oil and gas industry, comprising 0.4% of Ontario‘s total workforce in 2023.
- Employment in the mining, quarrying, and oil and gas industry increased by 13.9% in 2023.
- Over the 2024 to 2026 period, the mining, quarrying and oil and gas industry is expected to experience moderate job growth in Ontario.
ABOUT THE SECTOR
Composition and importance of the sector
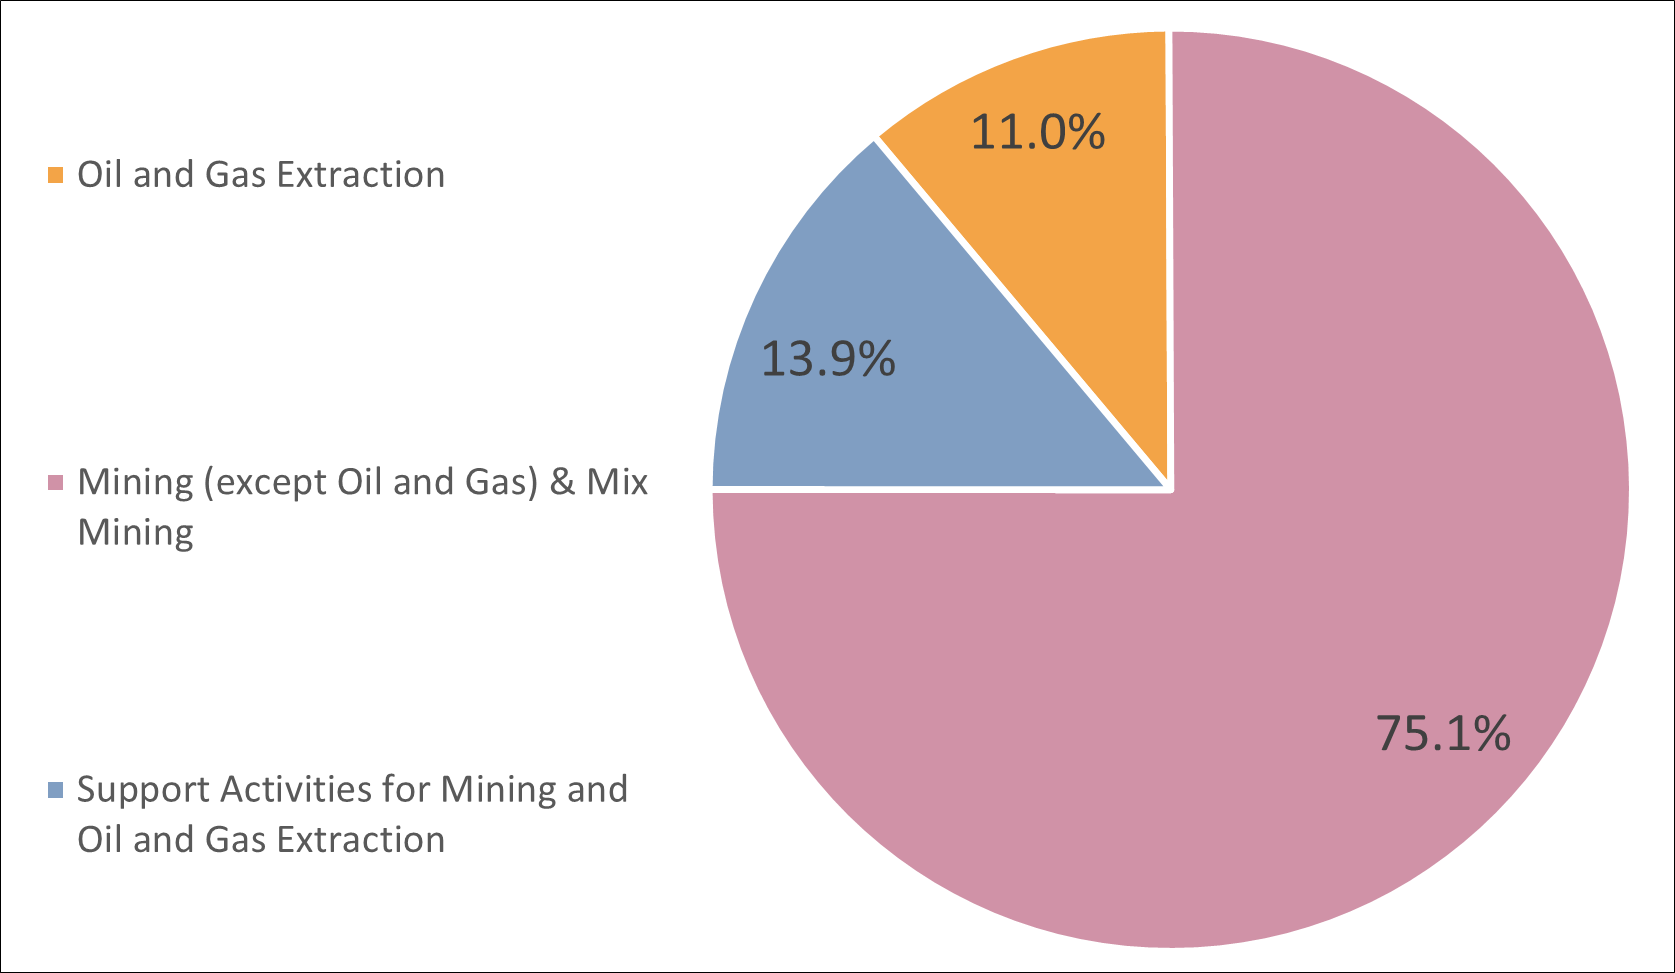
The mining, quarrying, and oil and gas sector includes firms that are engaged in the extraction of natural resources such as precious metals, non-metallic minerals, and oil and gas. Additionally, firms engaged in the development of mineral properties and mining operations are included in this sector. The majority of employment in this sector is derived from mining and quarrying, with oil and gas extraction making up a smaller percentage of total employment.
In 2023, the sector employed 35,300 people, comprising of 0.4% of Ontario‘s total employment. The sector contributed $7.1 billion to the provincial economy in 2023, accounting for 0.8% of total provincial GDP. Compared to the previous year, GDP increased by 0.5% ($37.4 million).
The mining, quarrying, and oil and gas industry is capital intensive and requires significant long-term investments to remain productive and competitive. In 2023, capital expenditure in Ontario‘s mining, quarrying, and oil and gas sector grew by 6.6% to reach $5.3 billion.
Ontario is the largest mineral producer in Canada, with $15.7 billion in mineral exploration alone in 2023. There are currently 36 active mining operations in Ontario – including 17 gold mines, 9 base metal mines (copper, nickel, zinc, and iron), and various others.
Graph 1. Employment Share by Subsector
Source: Statistics Canada, Labour Force Survey, Custom Table
Show graphic in plain text
Geographical distribution of employment
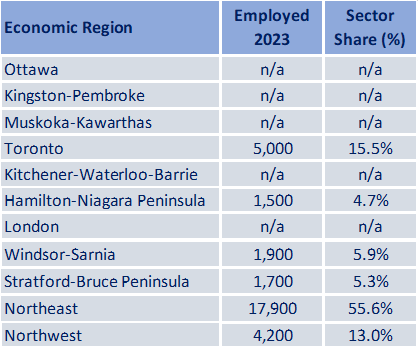
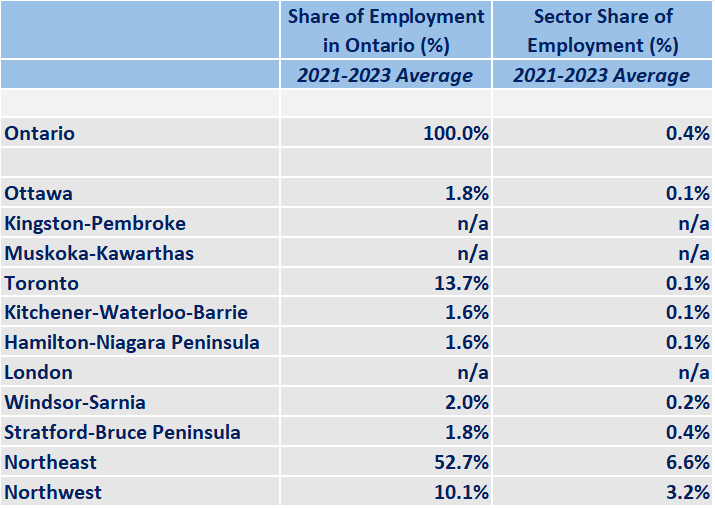
This industry is particularly prevalent in the Northeast Economic Region (ER) where 55.6% (17,900) of the provincial mining workforce is employed, primarily in metal ore mining. The industry is over-represented in this region, where 7.1% of total employment is in mining – compared to 0.4% for the whole province.
The second largest employment cluster is in the Toronto ER, where 15.5% of employment in this sector located. The majority of employment in this region is in administrative and executive positions at corporate headquarters in the Greater Toronto Area.
The Northwest ER is the third largest mining cluster in the province and is home to the “Ring of Fire” where significant mineral deposits have been discovered.
Table 1. Employment by Economic Region
Source: Statistics Canada, Labour Force Survey, Custom Table
Show table in plain text
WORKFORCE
Workforce characteristics
- The average hourly wage of workers in the mining, quarrying, and oil and gas sector in Ontario was $43.91 in 2023. This was higher than the provincial average of $29.18 amongst all sectors.
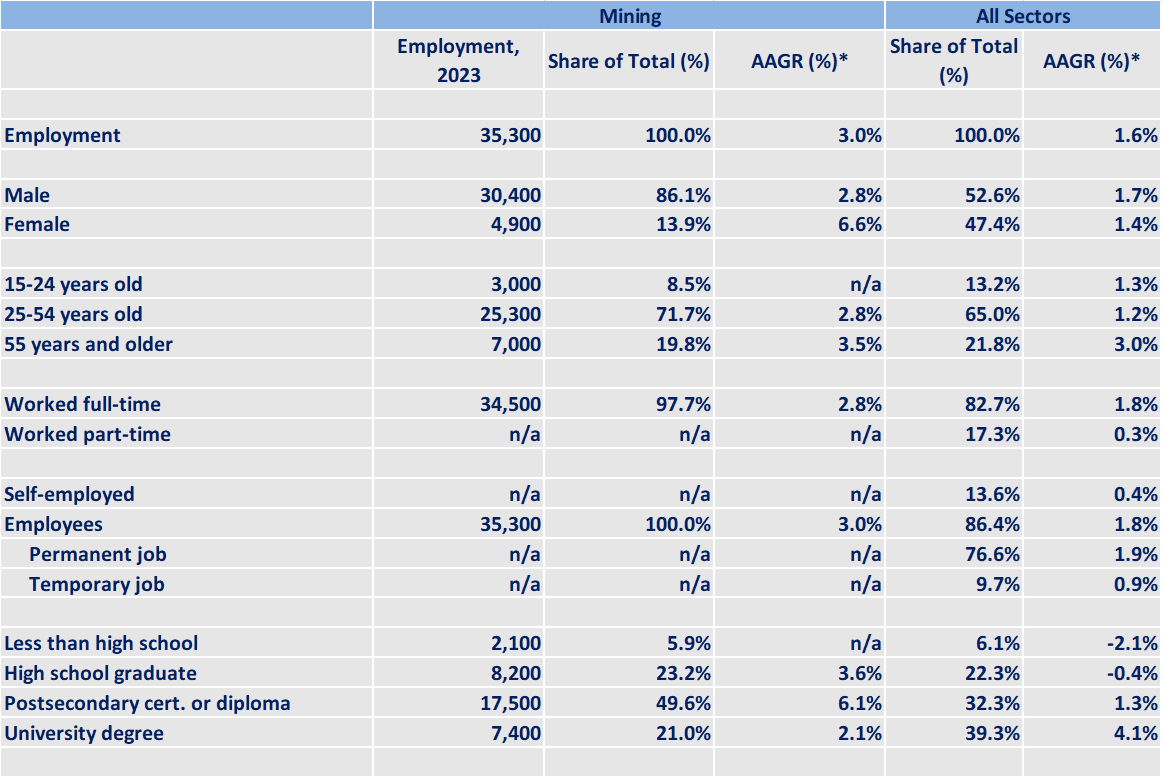
- This sector mainly employs males, who comprise 86.1% of the workforce. This is in contrast to total employment in the province where males comprise only 52.6% of the workforce.
- Full-time employees make up 97.7% of employment within this sector, compared to 82.7% in the labour market as a whole.
- Approximately 49.6% of workers in this sector have a post secondary certificate or a diploma, compared to 32.3% of the labour market as a whole.
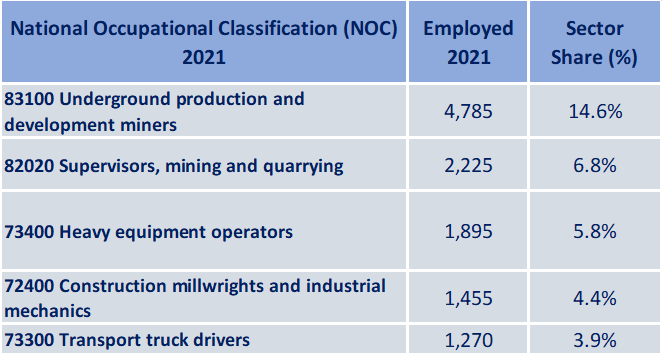
Table 2. Top 5 Occupations
Source: Statistics Canada, Labour Force Survey, Custom Table
Show table in plain text
RECENT HISTORY
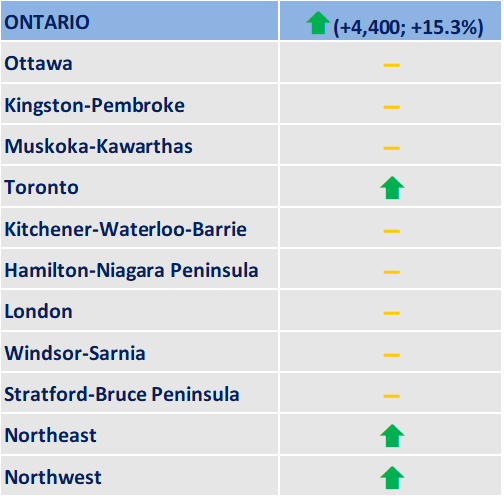
The mining, quarrying, and oil and gas sector experienced an average employment growth rate of 6.3% over the last 5 years (2019 – 2023). Employment declined only once annually over this period, by 11.7% in 2020. In 2023, the sector grew by 13.9%, adding 4,300 jobs. In July 2024, employment in the sector was 33,200, an increase of 4,400 jobs (+15.3%) from July 2019, pre-pandemic (28,800).
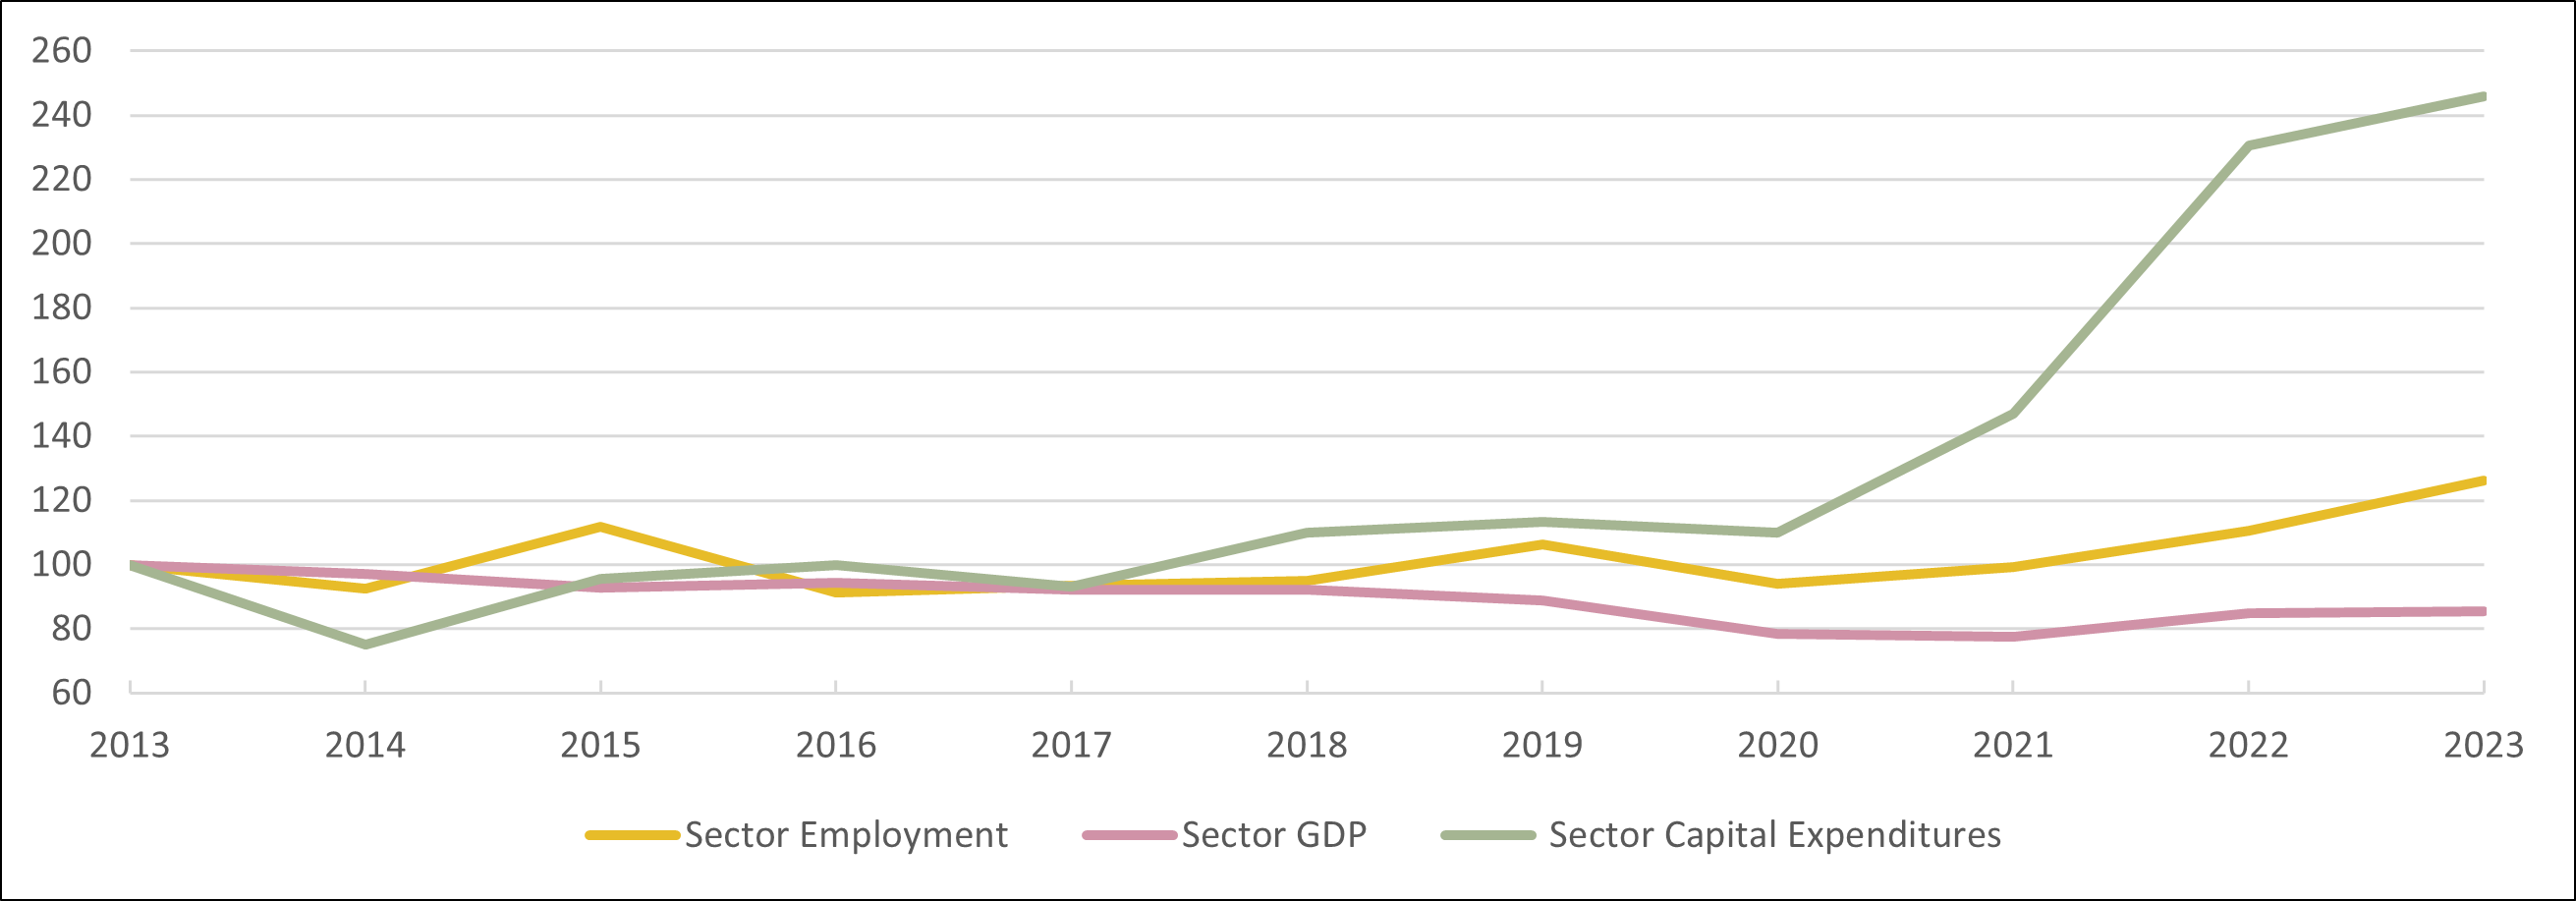
Employment in this industry is heavily dependent on the global market prices for metals and minerals because the market price for metals and minerals drives capital expenditure decisions, that is, how much a company is planning on investing in their business. Higher metal and mineral prices leads to greater investments, which leads to employment growth. In recent history, both the price of metals and minerals and capital expenditures have remained elevated since 2020.
In 2022, the Ontario Government announced it‘s first Critical Minerals Strategy, which aims to better connect mines in Northern Ontario to the manufacturing sector in the south, specifically to Ontario-based electric vehicle and battery manufacturers. Metals and minerals mined in Ontario such as copper, zinc, lithium, and nickel are critical raw materials for clean energy technology, particularly electric vehicle batteries. In 2023, over 10% of total new vehicle registrations were for zero-emission vehicles. The strengthening of the mining supply chain, along with numerous investments in EV manufacturing, have contributed to the growth of the provincial mining, quarrying, and oil and gas sector.
Graph 2. Sector Employment, Sector Gross Domestic Product (GDP), Sector Capital Expenditures in Ontario
Source: Statistics Canada, Labour Force Survey, Custom Table
*Data are expressed as index where year 2013 = 100%
Show graphic in plain text
EMPLOYMENT OUTLOOKS
Over the 2024 to 2026 period, Ontario‘s mining, quarrying and oil and gas industry is expected to experience moderate job growth.
International efforts to decarbonize the economy and reduce reliance on fossil fuels will lead to greater demand for the metals and minerals needed for green technology, such as copper, nickel, and lithium, all of which are mined in Ontario. Minerals like copper and nickel are key minerals for technologies that support a low-carbon economy and an increase in demand for these technologies will increase demand in the mining industry. Additionally, a report from the World Bank Group found that production of minerals, such as graphite, lithium and cobalt, could increase by nearly 500% by 2050, in order to meet the growing demand for clean energy technologies.
Investments in EV manufacturing in Ontario will likely also provide a boost to the mining sector in Ontario. Recently, the province has attracted large-scale investments for EV battery and related plants, including NextStar Energy's battery manufacturing plant in Windsor, PowerCo's battery cell gigafactory in St. Thomas, and Honda‘s plans for EV production in Alliston. These investments will drive demand for the related input minerals, further growing this sector in Ontario.
Table 3. Employment Change in Mining, Quarrying, and Oil and Gas Extraction: July 2019 vs. July 2024
Source: SStatistics Canada, Labour Force Survey, Custom Table
Show graphic in plain text
Key trends affecting the outlook of the mining, quarrying and oil and gas sector
- A shift towards decarbonization and clean energy technologies creating demand for certain minerals and metals
- Investments in EV manufacturing in Ontario
FOR FURTHER INFORMATION
Note: In preparing this document, the authors have taken care to provide clients with labour market information that is timely and accurate at the time of publication. Since labour market conditions are dynamic, some of the information presented here may have changed since this document was published. Users are encouraged to also refer to other sources for additional information on the local economy and labour market. Information contained in this document does not necessarily reflect official policies of Employment and Social Development Canada.
Prepared by: Labour Market and Socio-economic Information Directorate, Service Canada, Ontario Region
For further information, please contact LMSID at: Contact: Labour Market Information - Canada.ca (services.gc.ca)
APPENDIX
Table A1. Geographical Distribution of the Sector
Source: Statistics Canada, Labour Force Survey, Custom Table
Show graphic in plain text
Table A2. Characteristics of Employed Persons
Source: Statistics Canada, Labour Force Survey, Custom Table
*Average annual growth rate for last ten years available data
Show table in plain text
| Mining | All Sectors | |||||
|---|---|---|---|---|---|---|
| Employment, 2023 | Share of Total (%) | AAGR (%) * | Share of Total (%) | AAGR (%) * | ||
| Employment | 35,300 | 100.0% | 3.0% | 100.0% | 1.6% | |
| Male | 30,400 | 86.1% | 2.8% | 52.6% | 1.7% | |
| Female | 4,900 | 13.9% | 6.6% | 47.4% | 1.4% | |
| 15-24 years old | 3,000 | 8.5% | n/a | 13.2% | 1.3% | |
| 25-54 years old | 25,300 | 71.7% | 2.8% | 65.0% | 1.2% | |
| 55 years and older | 7,000 | 19.8% | 3.5% | 21.8% | 3.0% | |
| Worked full-time | 34,500 | 97.7% | 2.8% | 82.7% | 1.8% | |
| Worked part-time | n/a | n/a | n/a | 17.3% | 0.3% | |
| Self-employed | n/a | n/a | n/a | 13.6% | 0.4% | |
| Employees | 35,300 | 100.0% | 3.0% | 86.4% | 1.8% | |
| Permanent job | n/a | n/a | n/a | 76.6% | 1.9% | |
| Temporary job | n/a | n/a | n/a | 9.7% | 0.9% | |
| Less than high school | 2,100 | 5.9% | n/a | 6.1% | -2.1% | |
| High school graduate | 8,200 | 23.2% | 3.6% | 22.3% | -0.4% | |
| Postsecondary cert. or diploma | 17,500 | 49.6% | 6.1% | 32.3% | 1.3% | |
| University degree | 7,400 | 21.0% | 2.1% | 39.3% | 4.1% | |