
Other Services (except public administration) (NAICS 81): Ontario 2024–2026
HIGHLIGHTS
- There were 272,500 people employed in Ontario‘s other services industry, comprising 3.4% of Ontario‘s total workforce in 2023.
- Employment in the other services industry increased by 7.9% in 2023.
- Over the 2024 to 2026 period, the other services industry is expected to experience slight job growth in Ontario, dependent on macroeconomic factors, commuting patterns, and population growth.
ABOUT THE SECTOR
Composition and importance of the sector
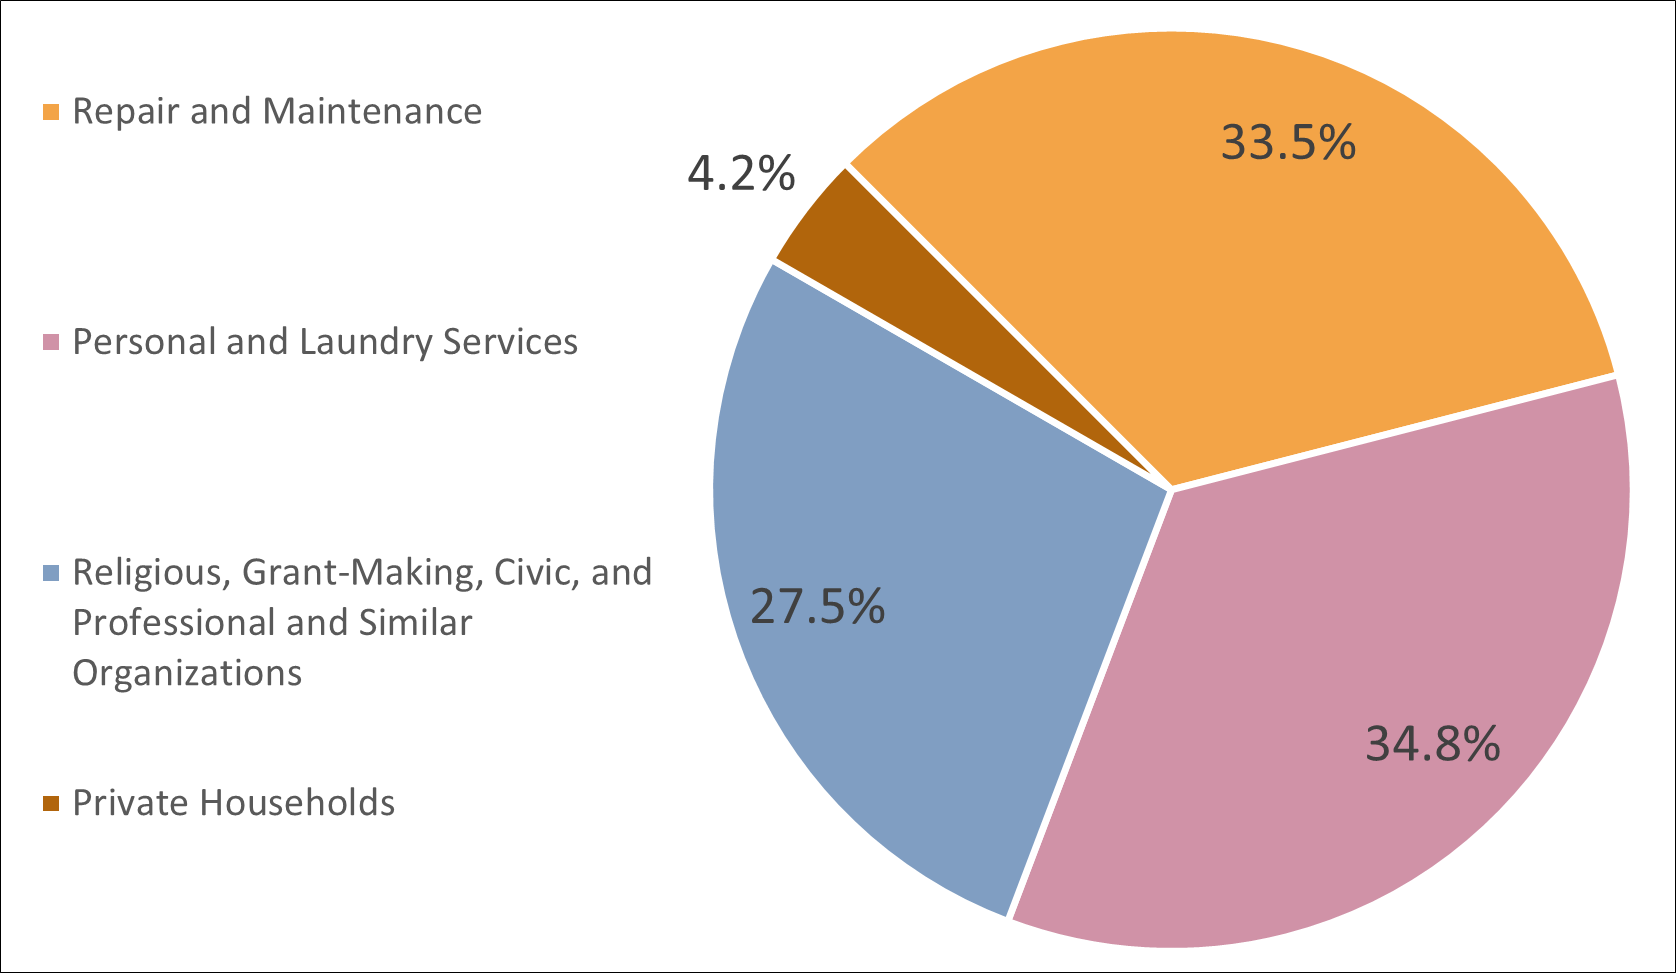
The other services industry comprises of establishments not classified to any other sector, primarily businesses:
- Engaged in repairing, or routine maintenance on motor vehicles, machinery, equipment and other products.
- Providing personal care services, funeral services, laundry services and other services to individuals, such as pet care services and photo finishing services.
- Organizing and promoting religious activities; supporting various causes through grant-making, advocating various social and political causes, and promoting and defending the interests of their members.
- Private households employing workers to assist in the operation of a household including cooks, maids, butlers, gardeners, and nanny services.
In 2023, the sector employed 272,500 people, comprising of 3.4% of Ontario‘s total employment. The sector contributed $16.3 billion to the provincial economy in 2023, increasing 3.8% (+$606.2 million) from the previous year. Other services accounts for 1.9% of Ontario‘s total GDP.
Graph 1. Employment Share by Subsector
Source: Statistics Canada, Labour Force Survey, Custom Table
Show graphic in plain text
Geographical distribution of employment
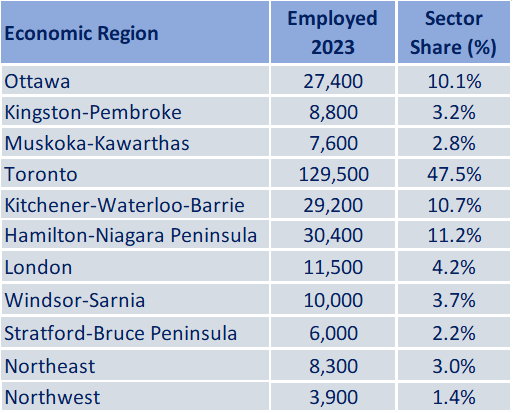
This industry has a strong presence in the Toronto Economic Region (ER) where nearly half (47.5%) of employment is located. Hamilton-Niagara and Kitchener-Waterloo-Barrie have the second and third highest distribution of employment. The primary functions of this industry cater to the population as a whole, for example, personal care services, maintenance services, and religious services. Therefore, there is a high correlation between population density and employment in this industry.
Table 1. Employment by Economic Region
Source: Statistics Canada, Labour Force Survey, Custom Table
Show table in plain text
WORKFORCE
Workforce characteristics
- The average hourly wage of workers in this sector was $26.17 in Ontario in 2023. Repair and maintenance workers earned $28.75, and personal and laundry service workers earned $21.38. In comparison, the provincial average across all sectors was $29.18 in 2023.
- Self-employment is more common in this industry; in 2023, in Ontario, 25.0% of individuals were self-employed, compared to 13.6% for the labour market as a whole.
- Part-time employment is more common in this sector; 22.9% of individuals were classified as part-time workers in 2023 in Ontario, compared to 17.3% in the labour market as a whole.
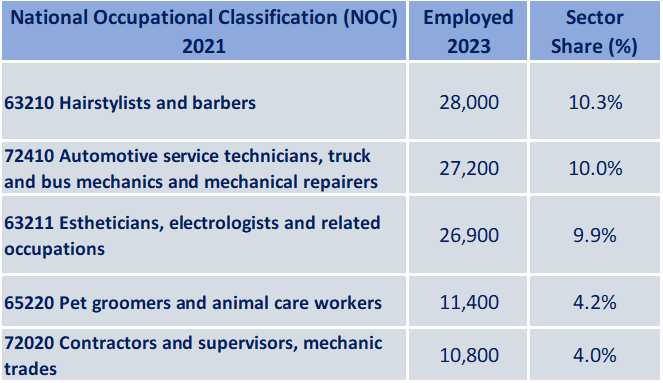
Table 2. Top 5 Occupations
Source: Statistics Canada, Labour Force Survey, Custom Table
Show table in plain text
RECENT HISTORY
The other services sector is comprised of four diverse subsectors that provide services to individuals and households. Employment in this sector is generally dependent on the state of the overall economy and related factors, such as household disposable income and population growth. As the population grows and economic conditions are favourable, a subsequent increase in household consumption may spur demand for labour in this sector. These industries rely primarily on household and individual consumption, which are linked to disposable income; therefore, demand is correlated with the economic cycle.
Since the 2008 recession, employment in this sector remained flat with moderate growth before declining significantly in 2020/2021 due to the COVID-19 pandemic. More recently, in 2023, employment grew for the first time since before the pandemic, growing by nearly 8% to 272,500 people. However, employment has yet to rebound to pre-pandemic levels as employment in the other services sector was 301,500 in July 2019.
Personal and Laundry Services
After experiencing large declines throughout the pandemic, employment rebounded in 2023, erasing nearly all of the losses that occurred during the height of COVID-19-related restrictions. However, the laundry services sector has also been impacted by ongoing changes to office culture. According to the Canadian Fabricare Association, work-from-home and hybrid models are impacting revenues of dry-cleaning companies, as professionals require less formal clothing.
Repair and Maintenance
Employment in this subsector increased by 13.0% (+10,500) to reach 91,300 in 2023. In this subsector, automotive and maintenance services generates the majority of operating revenue. Demand for services in this subsector can be linked to commuting patterns, and the availability and affordability of new vehicles. In 2023, commuting to work by car and public transit grew nationally, in accordance with many workplaces requiring staff back in office more often. The increase in commuters likely drove an increased demand for automotive repair services – as more driving leads to increased maintenance.
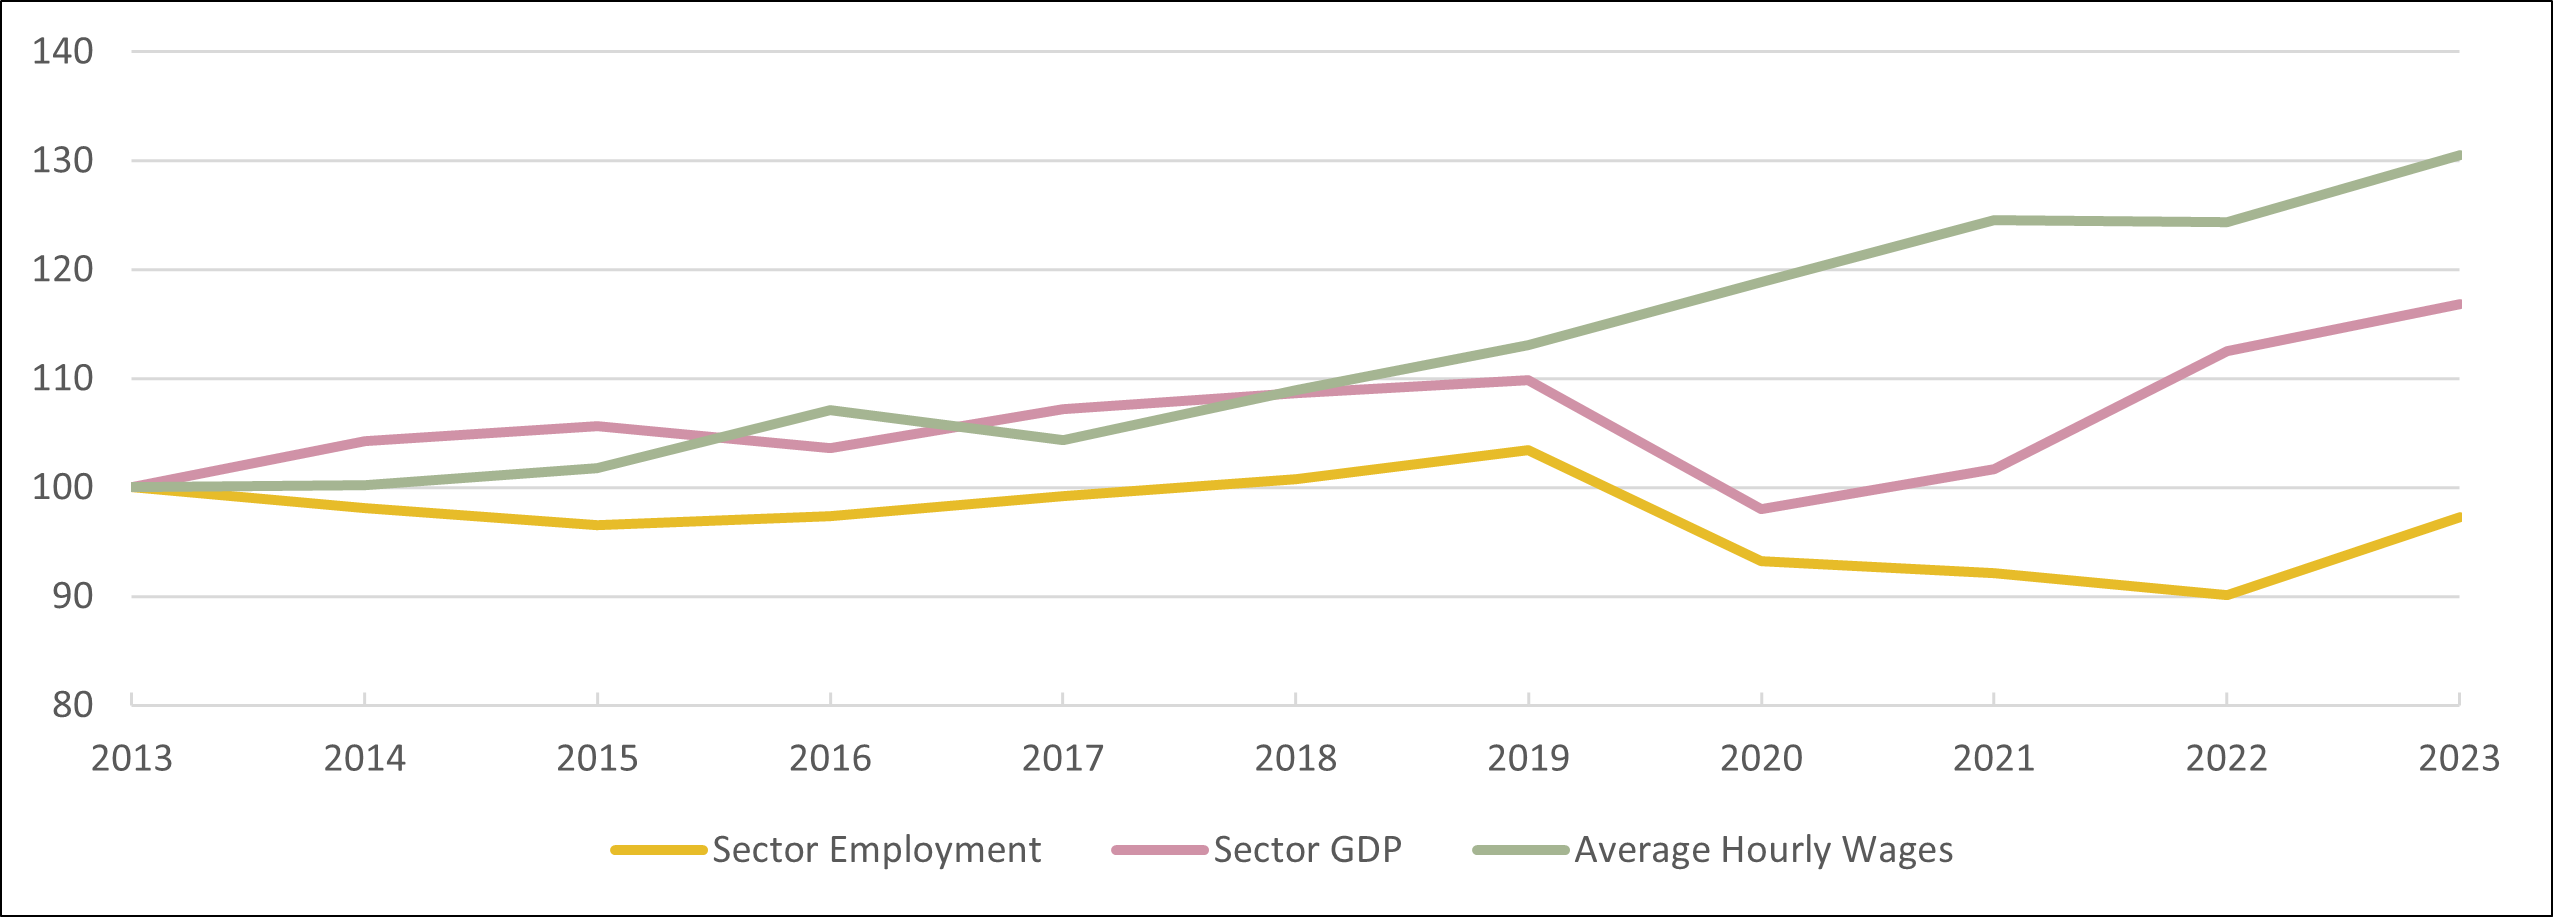
Graph 2. Sector Employment, Sector Gross Domestic Product (GDP), Sector Average Hourly Wage in Ontario
Source: Statistics Canada, Labour Force Survey, Table 14-10-0392-01 ; Gross Domestic Product By Industry, Table: 36-10-0402-01 ; Average hourly earnings for employees paid by the hour, by industry, Table 14-10-0064-01
*Data are expressed as index where year 2013 = 100%
Show graphic in plain text
EMPLOYMENT OUTLOOKS
Over the 2024 to 2026 period, the other services industry is expected to experience slight job growth in Ontario overall. Growth is largely dependent on consumption trends and the overall health of the economy.
After recording no growth in much of 2023, Canada‘s economy is set for a modest rebound in 2024. Inflation in Canada slowed to 2.5% in July 2024, the lowest since March 2021. Easing inflation has led to the Bank of Canada to begin a rate cutting cycle, which bodes well for this sector, as downward pressure on inflation and lower borrowing costs provide increased flexibility on household disposable income. In turn, households may have more money to spend on other services.
Repair and Maintenance
Employment outlooks for the repair and maintenance sub-sector are generally favourable in the near term. Relatively high costs for new vehicles may drive consumers to repair and maintain their current vehicle, which could benefit the subsector. Additionally, according to Statistics Canada, more commuters are travelling to work in May 2023 compared to pre-pandemic levels in May 2016, as the share of employed Canadians who work from home continued to decline in 2023. This bodes well for automotive repair services.
Personal Care Services
Employment outlooks for the personal care services subsector are positive due to favourable economic conditions. Gradual economic recovery and weakened inflation are likely to result in moderate relief for household disposable income, leading to more stable consumption and expenditure on non-essential services, which applies to many businesses in this sub-sector. Moreover, demographic changes such as increased population growth may increase demand for services within this subsector.
Table 3. Employment Change in Other Services: July 2019 vs. July 2024
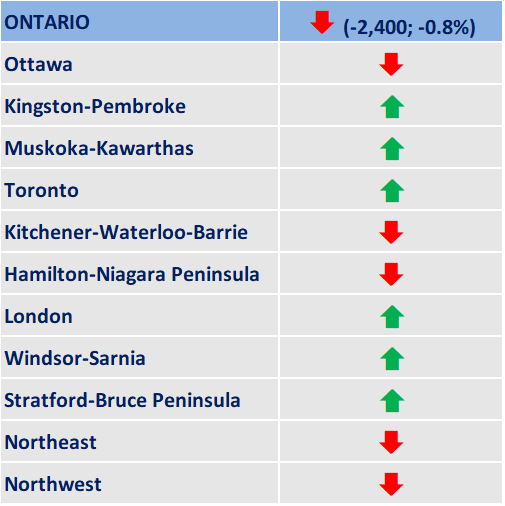
Source: Statistics Canada, Labour Force Survey, Custom Table
Show graphic in plain text
Key trends affecting the outlook of the other services sector
- Reduced inflation leading to Bank of Canada rate cuts, improving household disposable income
- Increased commuting activity due to workers returning to offices
- General population growth
FOR FURTHER INFORMATION
Note: In preparing this document, the authors have taken care to provide clients with labour market information that is timely and accurate at the time of publication. Since labour market conditions are dynamic, some of the information presented here may have changed since this document was published. Users are encouraged to also refer to other sources for additional information on the local economy and labour market. Information contained in this document does not necessarily reflect official policies of Employment and Social Development Canada.
Prepared by: Labour Market and Socio–economic Information Directorate, Service Canada, Ontario Region
For further information, please contact LMSID at: Contact: Labour Market Information – Canada.ca (services.gc.ca)
APPENDIX
Table A1. Geographical Distribution of the Sector
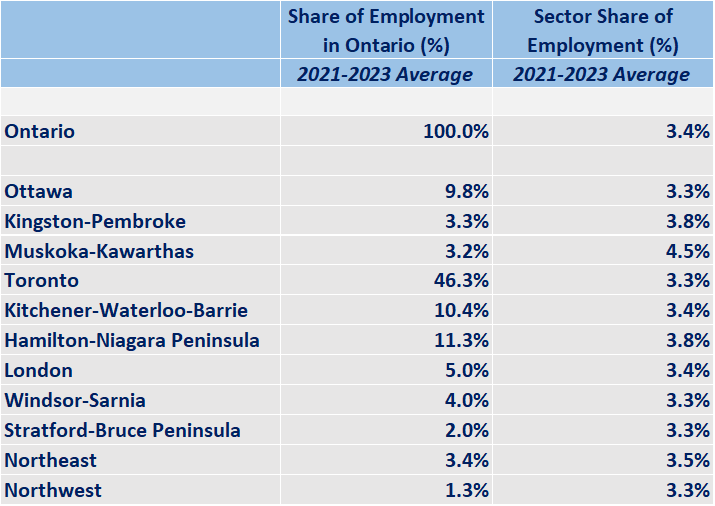
Source: Statistics Canada, Labour Force Survey, Custom Table
Show graphic in plain text
Table A2. Characteristics of Employed Persons
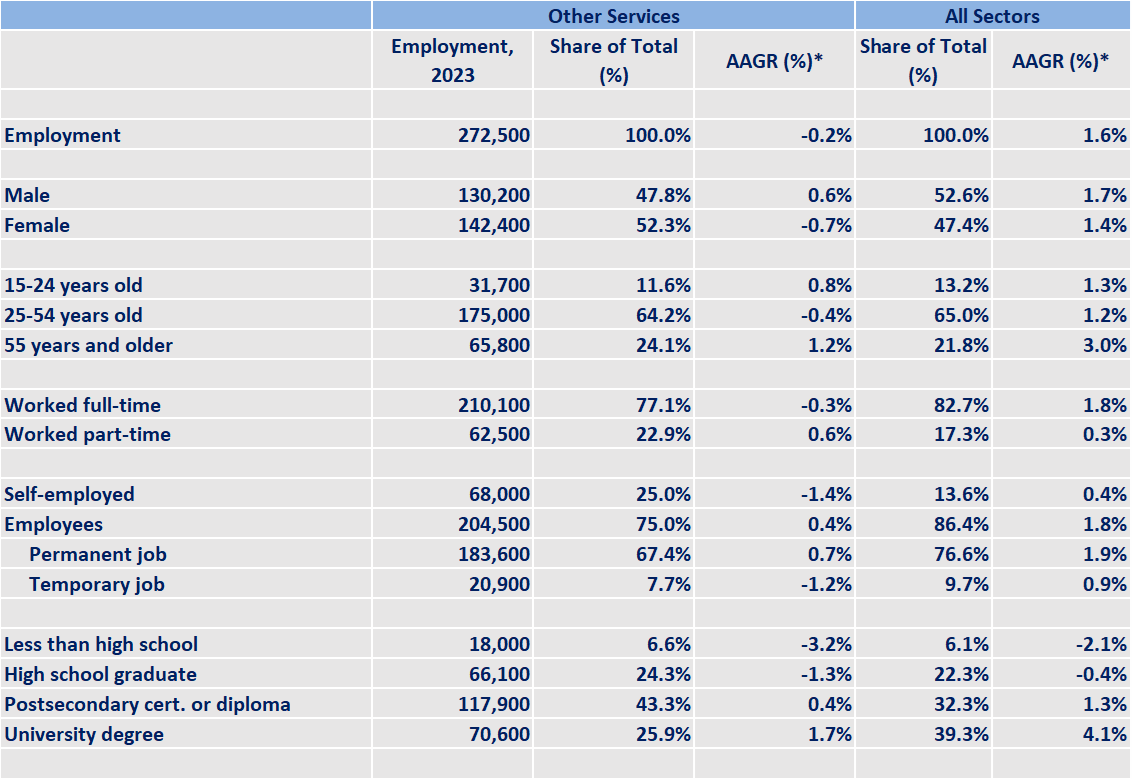
Source: Statistics Canada, Labour Force Survey, Custom Table
*Average annual growth rate for last ten years available data
Show table in plain text
| Other Services | All Sectors | |||||
|---|---|---|---|---|---|---|
| Employment, 2023 | Share of Total (%) | AAGR (%)* | Share of Total (%) | AAGR (%)* | ||
| Employment | 272,500 | 100.0% | -0.2% | 100.0% | 1.6% | |
| Male | 130,200 | 47.8% | 0.6% | 52.6% | 1.7% | |
| Female | 142,400 | 52.3% | -0.7% | 47.4% | 1.4% | |
| 15-24 years old | 31,700 | 11.6% | 0.8% | 13.2% | 1.3% | |
| 25-54 years old | 175,000 | 64.2% | -0.4% | 65.0% | 1.2% | |
| 55 years and older | 65,800 | 24.1% | 1.2% | 21.8% | 3.0% | |
| Worked full-time | 210,100 | 77.1% | -0.3% | 82.7% | 1.8% | |
| Worked part-time | 62,500 | 22.9% | 0.6% | 17.3% | 0.3% | |
| Self-employed | 68,000 | 25.0% | -1.4% | 13.6% | 0.4% | |
| Employees | 204,500 | 75.0% | 0.4% | 86.4% | 1.8% | |
| Permanent job | 183,600 | 67.4% | 0.7% | 76.6% | 1.9% | |
| Temporary job | 20,900 | 7.7% | -1.2% | 9.7% | 0.9% | |
| Less than high school | 18,000 | 6.6% | -3.2% | 6.1% | -2.1% | |
| High school graduate | 66,100 | 24.3% | -1.3% | 22.3% | -0.4% | |
| Postsecondary cert. or diploma | 117,900 | 43.3% | 0.4% | 32.3% | 1.3% | |
| University degree | 70,600 | 25.9% | 1.7% | 39.3% | 4.1% | |