
Primary Metal Product Manufacturing (NAICS 331): Ontario, 2024–2026
HIGHLIGHTS
- Ontario represents about half of the business and employees in Canada‘s primary metal (PM) manufacturing subsector.
- There were 29,400 people employed in the PM manufacturing subsector in Ontario, comprising 0.4% of the province‘s total workforce in 2023.
- Employment in Ontario‘s PM manufacturing subsector increased by 13.5% in 2023.
- Employment in the industry is expected to remain stable over the 2024-2026 forecast period, despite some challenges due to uncertain economic conditions and softened demand in key end user industries.
ABOUT THE SECTOR
Composition and importance of the sector
The primary metal (PM) manufacturing subsector plays a crucial role in Ontario‘s industrial landscape as it provides intermediary and end-use goods for other industries in the province, including construction, motor vehicle manufacturing and natural resources.
Ontario is home to almost half (42.7%) of the workers in Canada‘s PM manufacturing subsector, making it the largest manufacturer of primary metals in Canada Employment in the PM manufacturing sector in Ontario increased by 13.5% (+3,500) in 2023 and is 10.5% above pre-pandemic levels.
In 2023, the PM manufacturing subsector accounted for 5.7% of the total provincial manufacturing gross domestic product (GDP) and 7.1% of Ontario‘s total exports, with over 78% of the exports headed towards the Untied States.
Graph 1. Employment Share by Subsector
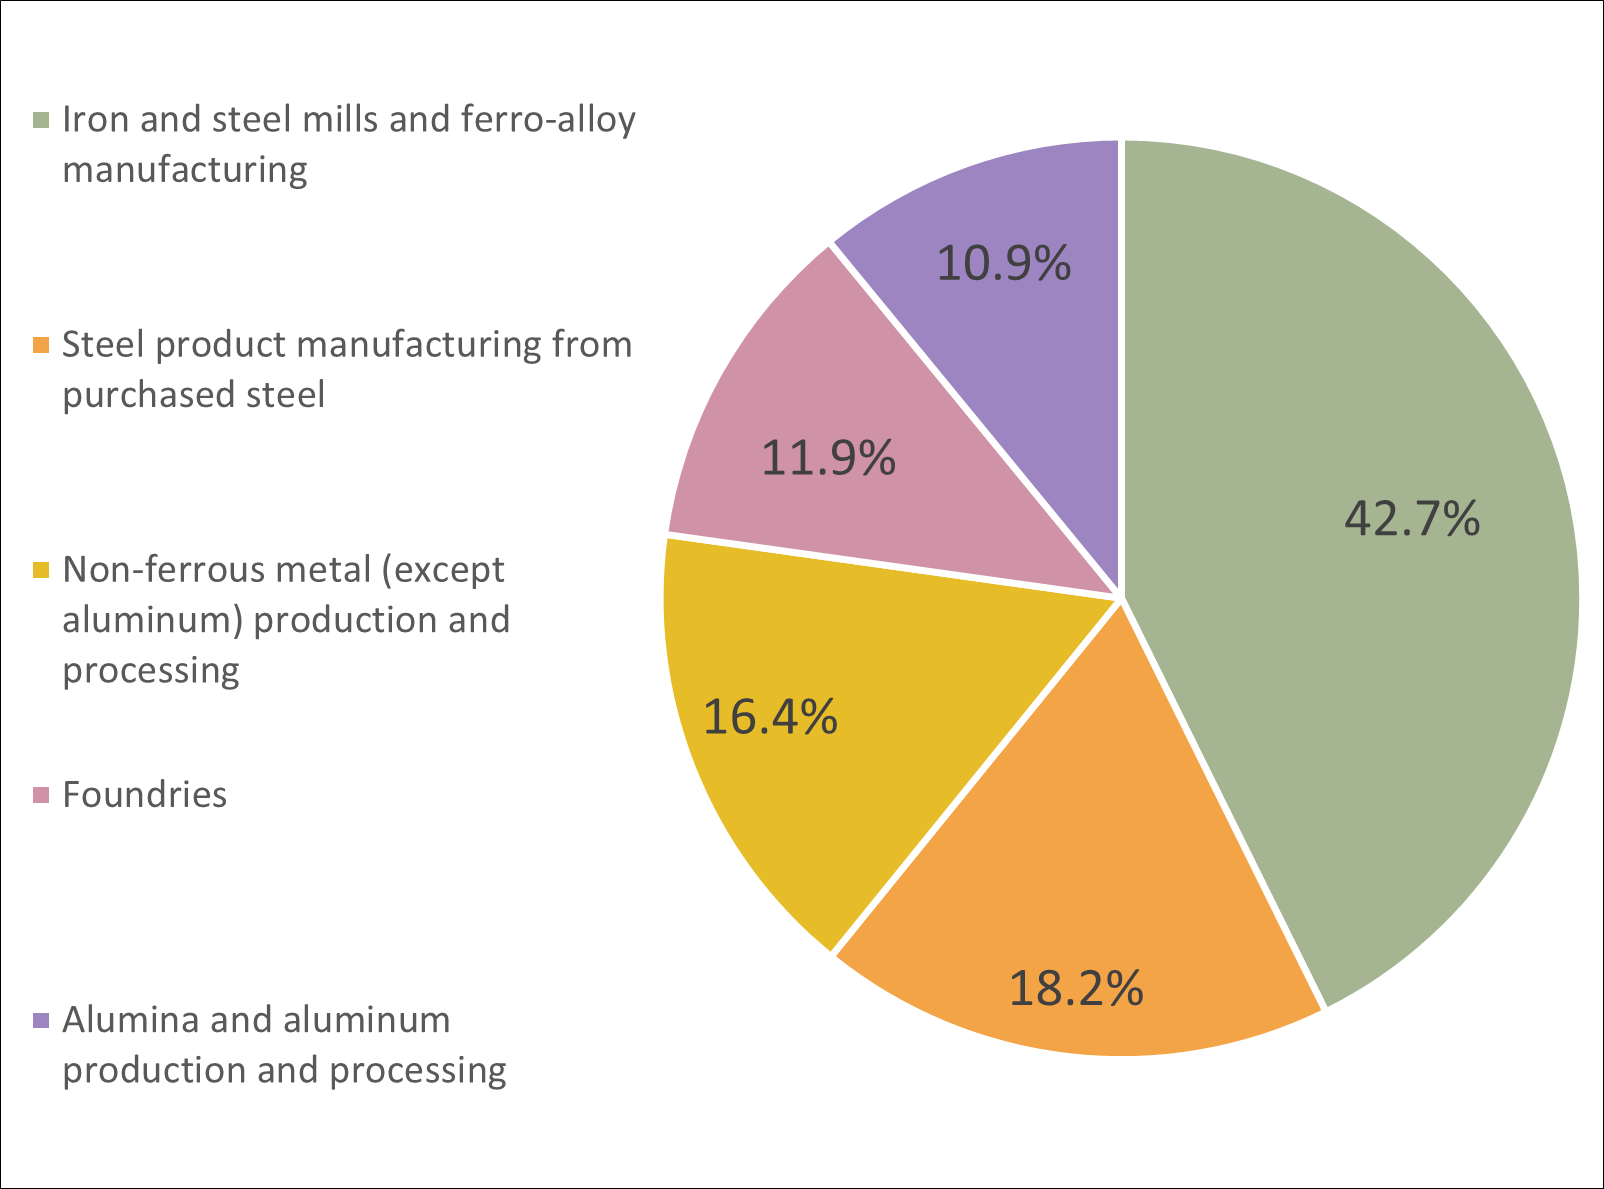
Source: Statistics Canada, Labour Force Survey, Custom Table
Show graphic in plain text
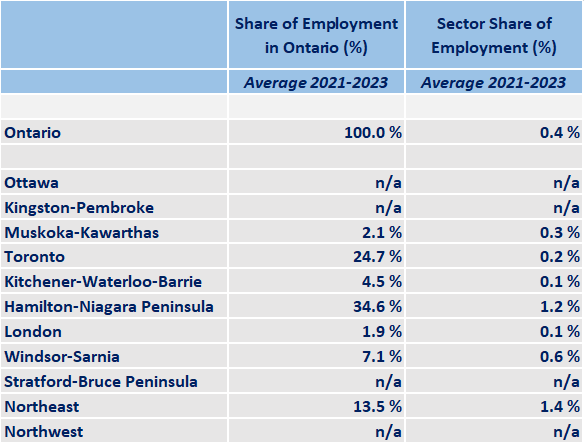
Geographical distribution of employment
The Hamilton-Niagara Peninsula economic region (ER) represents over a third (39.5%) of Ontario‘s employment in PM manufacturing, in accordance with the City of Hamilton‘s rich history in steel production.
Hamilton has one of the highest concentrations of steel manufacturing activity in Canada with large steelmakers and steel product manufacturers, such as Stelco Inc. and ArcelorMittal Dofasco Inc. present in the region. More than half of all workers in iron and steel mills and ferro-alloy manufacturing in Ontario worked in the region in 2021.
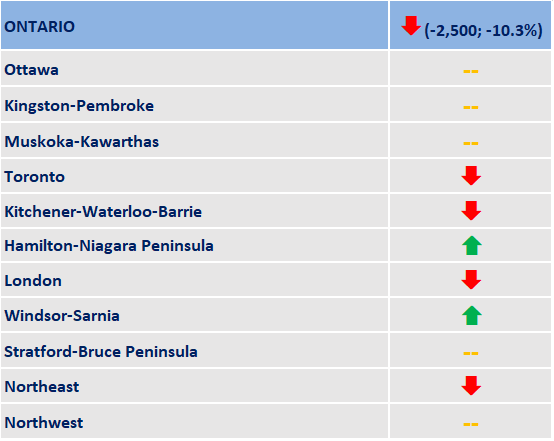
Employment in the primary metal manufacturing sector was over-represented in the Hamilton-Niagara Peninsula, Northeast, and Windsor-Sarnia ERs, accounting for 1.5%, 1.4%, and 0.7% of total employment in the ER, respectively, compared to 0.4% for Ontario as a whole.
Table 1. Employment by Economic Region
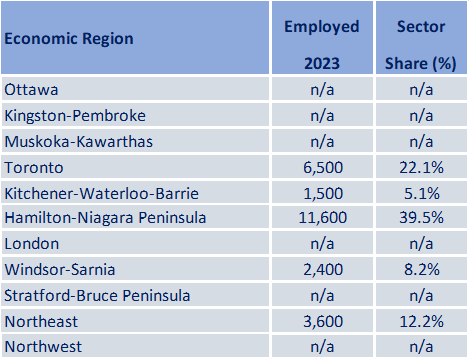
Source: Statistics Canada, Labour Force Survey, Custom Table
Show table in plain text
WORKFORCE
Workforce characteristics
- Average weekly earnings for PM manufacturing employees in Canada was $1,847 in 2023, higher than the average weekly earnings for manufacturing employees overall in Canada ($1,311).
- The PM manufacturing subsector is male dominated, with men representing 85.0% of the provincial employment in 2023, while representing 52.6% of Ontario‘s workforce.
- University graduates make up a lower proportion of the industry‘s workforce at just 18.4%, as compared to 39.3% of the total provincial workforce.
- Almost one in three workers (28.2%) in the industry were aged 55 years and over, higher than the proportion of older workers across all industries in Ontario (21.8%).
Table 2. Top 5 Occupations
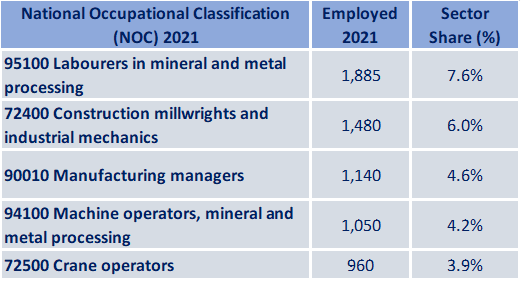
Source: Statistics Canada, Labour Force Survey, Custom Table
Show table in plain text
RECENT HISTORY
The PM manufacturing industry plays a significant role in Ontario‘s economy, providing base materials for many of the province‘s core industries, including manufacturing (automotive, fabricated metal, machinery, transportation), construction, and oil and gas extraction. Provincial employment in PM manufacturing grew significantly in 2023, with an increase of 3,500 jobs (+13.5%). Comparatively, overall manufacturing employment in Ontario increased by 2.7% over the same period.
Ontario‘s PM manufacturing industry has experienced both challenges and opportunities in recent years. While pent up demand from the COVID-19 pandemic eased and supply chain issues were resolved, boding well for the sector, rising interest rates and economic uncertainty slowed growth in key downstream industries. Additionally, Canada imposed a ban on all Russian steel and aluminum imports in March 2023 and a 25 percent tariff on Chinese steel and aluminum imports in October 2024. Both policies impact domestic manufacturers who rely on imported semi-finished steel and aluminum products.
Recently, several PM firms across Ontario have made notable investments in expansions and upgrades. For example, Electra Battery Materials Corp. in Temiskaming Shores, Wabi Iron & Steel Corp. in New Liskeard and Numesh Ontario Inc. in Brantford each made investments to expand production capacity. Investments in clean steelmaking technologies were made by ArcelorMittal Dofasco, Algoma Steel Inc. and Stelco Inc. to phase out coal-fired steelmaking and reduce carbon dioxide emissions. As well, Vale Canada Limited and Glencore Canada Corporation continue to update their production and processing facilities in Sudbury and Port Colborne, and Tennaris (Algoma Tubes Inc.) has invested more than $200 million to centralize its steel pipe manufacturing operations in Sault Ste. Marie.
Additionally, several major projects continue to drive demand for PM manufacturing, including the construction of Gordie Howe International Bridge in Windsor, transit expansion projects like Metrolinx‘s Ontario Line in Toronto, and the nuclear power plant refurbishment projects at Bruce Power and Darlington Nuclear Generating Station. On the whole, these types of investments and projects have supported the strong employment witnessed in Ontario‘s primary metal manufacturing sector.
Graph 2. Sector Employment, Sector Sales, Sector Gross Domestic Product (GDP)
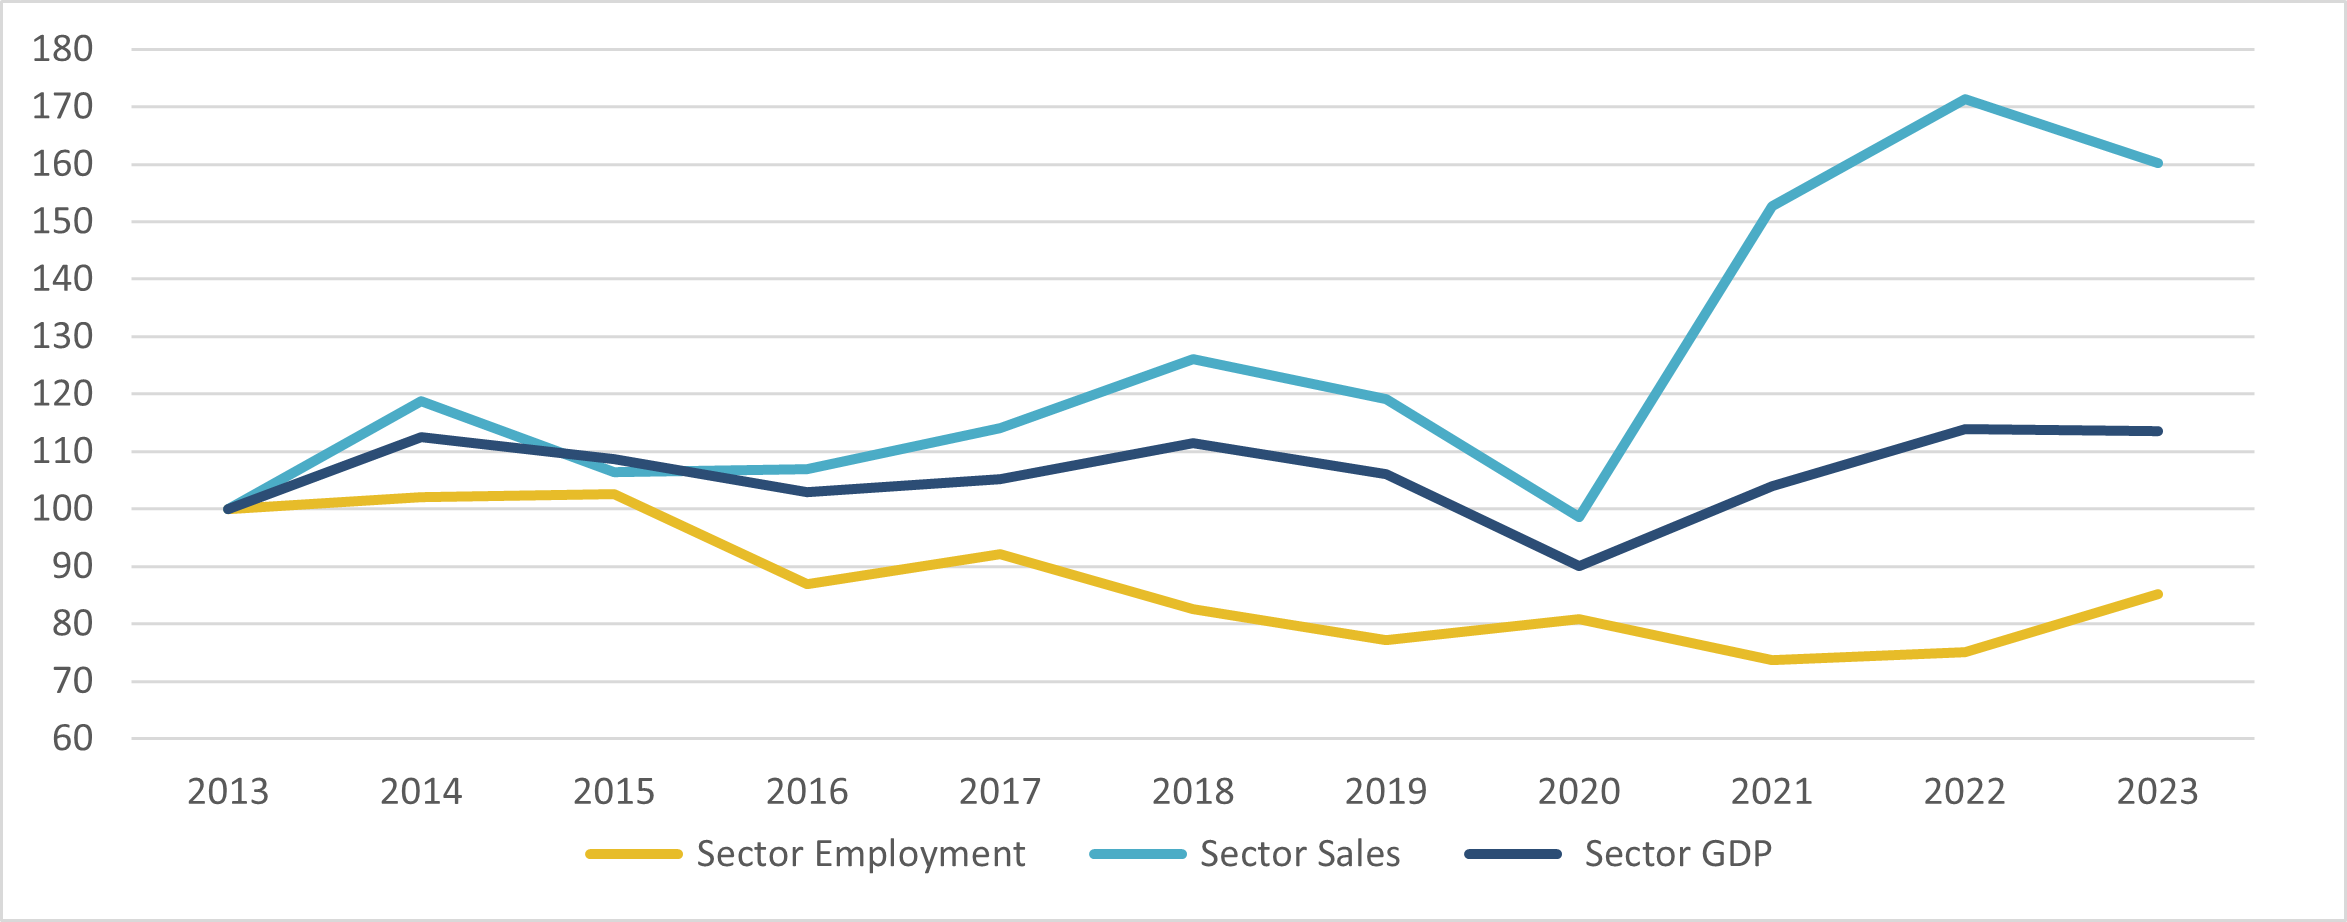
Sources: Statistics Canada, Custom Tables
*Data are expressed as index where year 2013 =100%
Show graphic in plain text
EMPLOYMENT OUTLOOKS
Employment in Ontario‘s PM manufacturing industry will likely remain stable over the 2024 to 2026 forecast period.
Companies in PM manufacturing continue to require higher skilled labour to meet the shift towards advanced manufacturing. Workers often require knowledge of computer-controlled tools, robotics, and manufacturing software, such as computer-aided design (CAD) and computer-aided manufacturing (CAM). PM manufacturing also requires engineers, technologists and technicians to work on process improvements and new products to meet the demands of downstream industries – for example, steel wire and high strength steel for the auto industry, to reduce weight and boost fuel efficiency. Further, industry reports suggest that companies may face challenges recruiting specific specialized workers, such as construction millwrights and industrial mechanics
Subdued domestic demand is causing some downward pressure on new orders and sales for primary metal manufacturing in Canada. High interest rates, low economic growth projections, slowing domestic demand for steel in China, and new tariffs on Chinese steel and aluminum have all impacted demand for PM manufacturing. Simultaneously, there has been an increased push towards buying American-produced steel in the United States, which is one of Ontario‘s major export locations. This could result in lower PM manufacturing exports, affecting the outlook for the subsector. As well, some PM suppliers are also facing increased foreign competition stemming from illegal dumping of cheap steel, causing prices to fall and manufacturers‘ profit margins to narrow.
Conversely, large industrial investments, particularly in automotive vehicle and parts manufacturing to produce electric vehicles and their parts, will provide stimulus for PM manufacturing products. Furthermore, investments in aerospace manufacturing,, public transit expansion, infrastructure construction, and mining projects in northern Ontario will also support demand and employment in this subsector. However, new high-tech methods in steelmaking have improved productivity in PM manufacturing, leading to a reduction in the number of workers required.
Table 3. Employment Change in Primary Metal Manufacturing: July 2019 to July 2024
Source: Statistics Canada, Labour Force Survey, Custom Table
Show graphic in plain text
Key trends affecting the outlook of the primary metal manufacturing sector
- Shifts toward advanced manufacturing techniques requiring higher skilled labour
- Subdued global and domestic demand, and new industry tariffs
- Large investments in automotive manufacturing, aerospace manufacturing, public transit expansions, infrastructure construction and mining projects in northern Ontario
FOR FURTHER INFORMATION
Note: In preparing this document, the authors have taken care to provide clients with labour market information that is timely and accurate at the time of publication. Since labour market conditions are dynamic, some of the information presented here may have changed since this document was published. Users are encouraged to also refer to other sources for additional information on the local economy and labour market. Information contained in this document does not necessarily reflect official policies of Employment and Social Development Canada.
Prepared by: Labour Market and Socio–economic Information Directorate, Service Canada, Ontario Region
For further information, please contact LMSID at: Contact: Labour Market Information – Canada.ca (services.gc.ca)
APPENDIX
Table A1. Geographical Distribution of the Sector
Source: Statistics Canada, Labour Force Survey, Custom Table
Show graphic in plain text
Table A2. Characteristics of Employed Persons
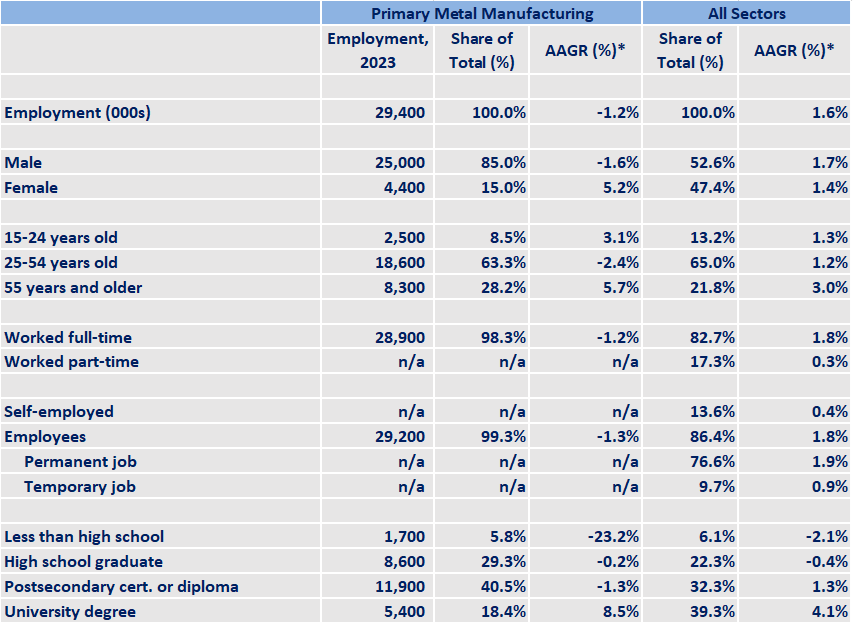
Source: Statistics Canada, Labour Force Survey, Custom Table
*Average annual growth rate for last ten years available data
Show table in plain text
| Primary Metal Manufacturing | All Sectors | |||||
|---|---|---|---|---|---|---|
| Employment, 2023 | Share of Total (%) | AAGR (%) * | Share of Total (%) | AAGR (%) * | ||
| Employment (000s) | 29,400 | 100.0% | -1.2% | 100.0% | 1.6% | |
| Male | 25,000 | 85.0% | -1.6% | 52.6% | 1.7% | |
| Female | 4,400 | 15.0% | 5.2% | 47.4% | 1.4% | |
| 15-24 years old | 2,500 | 8.5% | 3.1% | 13.2% | 1.3% | |
| 25-54 years old | 18,600 | 63.3% | -2.4% | 65.0% | 1.2% | |
| 55 years and older | 8,300 | 28.2% | 5.7% | 21.8% | 3.0% | |
| Worked full-time | 28,900 | 98.3% | -1.2% | 82.7% | 1.8% | |
| Worked part-time | n/a | n/a | n/a | 17.3% | 0.3% | |
| Self-employed | n/a | n/a | n/a | 13.6% | 0.4% | |
| Employees | 29,200 | 99.3% | -1.3% | 86.4% | 1.8% | |
| Permanent job | n/a | n/a | n/a | 76.6% | 1.9% | |
| Temporary job | n/a | n/a | n/a | 9.7% | 0.9% | |
| Less than high school | 1,700 | 5.8% | -23.2% | 6.1% | -2.1% | |
| High school graduate | 8,600 | 29.3% | -0.2% | 22.3% | -0.4% | |
| Postsecondary cert. or diploma | 11,900 | 40.5% | -1.3% | 32.3% | 1.3% | |
| University degree | 5,400 | 18.4% | 8.5% | 39.3% | 4.1% | |