
Territories Sector Profile: Public Administration
NAICS 91
- Workforce characteristics
- Occupation of interest: Professional occupations in government services (NOC 414)
Highlights
- The public administration sector employed the highest proportion of workers in 2022 out of all sectors. Public administration employed 14,300 workers, 23% of all people employed in the territories. [1]
- Across all three territories in 2022, employment distribution between males and females was fairly even, with slightly more women employed in the public service, except for Nunavut where men make up a slightly higher proportion.
- In 2022, there were 3,200 employees in professional occupations in government services across the three territories. The Northwest Territories employed the most people in occupations in government services (1,300 workers), while Yukon had 1,000 workers in this occupation and Nunavut had 800.
- In the Northwest Territories, public administration was the second highest contributor (next to mining) to GDP in 2022 producing $799.6M (20%) of overall GDP.
About the Sector
Composition and importance of the sector
The public administration sector comprises establishments primarily engaged in activities of a governmental nature, that is, the enactment and judicial interpretation of laws and their pursuant regulations, and the administration of programs based on them. There are multiple sub-sectors within the public administration sector including, federal government public administration, provincial and territorial public administration, local, municipal, and regional public administration, Aboriginal public administration, international and other extra‑territorial public administration. [2]
Occupations in the public administration sector vary from administrative, such as government managers, policy analysts and program officers, to hands-on jobs such as firefighters, social and community service workers, principals, education assistants and police officers. Public administration includes work at the federal, provincial/territorial, and local scales.
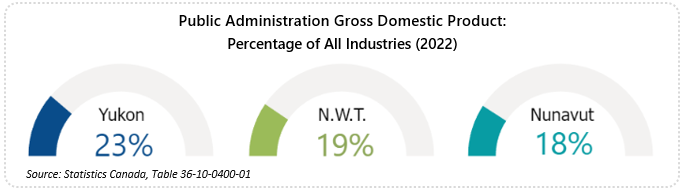
Public Administration Gross Domestic Product: Percentage of All Industries
Source: Statistics Canada, Table 36-10-0400-01
Show graphic in plain text
Territory
% of All
Industries
Yukon
23%
Northwest
Territories19%
Nunavut
18%
The public administration sector is the largest contributor to the gross domestic product (GDP) in Yukon and the second largest contributor to GDP in the Northwest Territories and in Nunavut after the mining, quarrying, and oil and gas extraction sector. The territorial public administration subsector is the largest GDP contributor for public administration in all three territories. Between 2021 and 2022, Yukon's GDP in public administration grew by 1.1% to $668.7 million, and in Nunavut by 0.6% to $610.1 million. In the Northwest Territories, GDP from public administration declined by 0.6% to $799.6 million. [3]
Geographical distribution of employment

Public Administration Employment: Percentage of All Industries
Source: Statistics Canada Labour Force Survey, ESDC custom tables
Show graphic in plain text
Territory
% of All
Industries
Yukon
21%
Northwest
Territories24%
Nunavut
25%
Public administration is the largest employer in each of the three territories. In 2022, it employed 4,800 people in Yukon, 5,900 workers in Northwest Territories and 3,600 workers in Nunavut. Public administration accounted for almost 23% of the total territorial workforce in 2022. Nunavut had the highest proportion (26%) of people employed in the public administration sector compared to other sectors, while Yukon has the lowest (21%) across the three territories. [4]
Workforce
Workforce characteristics
Across all three territories in 2022, employment distribution between males and females was fairly even, with slightly more women employed in the public service, except for Nunavut where men make up a slightly higher proportion. In Yukon, 54% of employees in public administration were female in 2022. Across all sectors, 2,600 (27%) of female employees worked in public administration. For males, 2,200 employees (21%) across all sectors were employed in public administration. In the Northwest Territories in 2022, 3,300 employees (56%) in public administration were female. This is 29% of all females employees across all sectors, while males working in public administration made up 25% of employed males in the Northwest Territories. In Nunavut in 2022, 1,700 females (47%) worked in public administration, making up 25% of all females employed across all sectors. While males in public administration account for 29% of males employed across all sectors. [5]
In the Northwest Territories, 25% of people employed in the public service are Indigenous, and in Nunavut, 23% of people employed in public administration are Inuit. [6]
Occupation of interest: Professional occupations in government services (NOC 414)
This section focuses on professional occupations in government services, which includes everything from natural and applied science policy researchers, to program officers in the areas of social policy, health policy, education policy, economic policy, recreation, sports, and fitness policy. Most of these occupations are within government, although there are a small number of other occupations in social sciences.
Across the territories, people are employed within this occupation at all levels of government, including federal, territorial, municipal, local, and Indigenous governments. Employees in this occupational grouping perform duties such as monitoring data, preparing reports, forecasting, and administering programs.
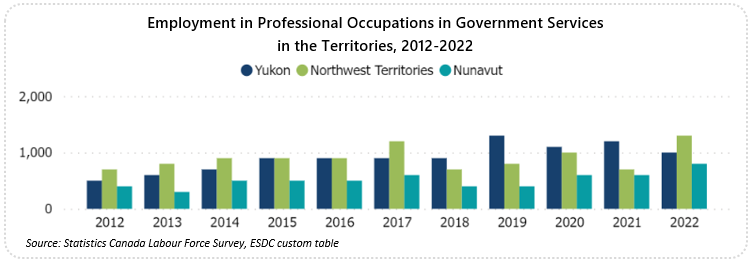
Employment in Professional Occupations in Government Services in the Territories
Note: Figures shown are employment estimates
Source: Statistics Canada Labour Force Survey, ESDC custom table
Show graphic in plain text
Year
Yukon
Northwest
TerritoriesNunavut
2012
500
700
400
2013
600
800
300
2014
700
900
500
2015
900
900
500
2016
900
900
500
2017
900
1,200
600
2018
900
700
400
2019
1,300
800
400
2020
1,100
1,000
600
2021
1,200
700
600
2022
1,000
1,300
800
In 2022, there were 3,200 employees in professional occupations in government services across the three territories. The Northwest Territories employed the most people in occupations in government services (1,300 workers), while Yukon had 1,000 workers in this occupation and Nunavut had 800.
Wage data isn't available for the Territories, however, the average wage for professional occupations in government services in Canada was $41.68 an hour in 2022. This was well above the national average wage for all occupations which was $31.96 in 2022. [7] This is also higher than the median wage for all occupations in the Northwest Territories ($38.00), Nunavut ($35.90), and Yukon ($35.00). [8]
Recent History
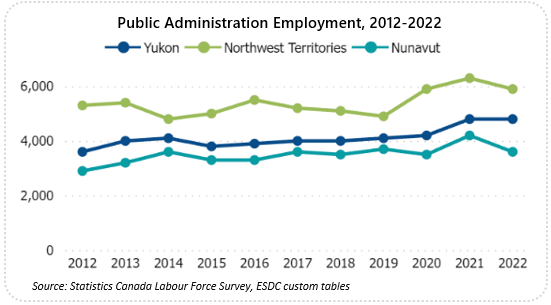
Public Administration Employment
Note: Figures shown are employment estimates
Source: Statistics Canada Labour Force Survey, ESDC custom tables
Show graphic in plain text
Year
Yukon
Northwest
TerritoriesNunavut
2012
3,600
5,300
2,900
2013
4,000
5,400
3,200
2014
4,100
4,800
3,600
2015
3,800
5,000
3,300
2016
3,900
5,500
3,300
2017
4,000
5,200
3,600
2018
4,000
5,100
3,500
2019
4,100
4,900
3,700
2020
4,200
5,900
3,500
2021
4,800
6,300
4,200
2022
4,800
5,900
3,600
Yukon
Public administration employment in Yukon remained relatively stable from 2012 to 2019 and increased considerably during the COVID-19 pandemic. In fact, employment jumped 14.3% to 4,800 people between 2020 and 2021 – the highest number of people employed in record. In 2022, employment plateaued and remained the same as 2021. [9]
The average weekly earnings in Yukon's public administration sector continue to rise each year. [10] In 2022, Yukon's average weekly earning was $2,041.58 in the federal government public administrations; $1833.35 in territorial public administration; and $1045.34 in Indigenous public administration. [11]
In the North, Indigenous people are underrepresented in the public administration sector. According to the Government of Yukon, the Indigenous population in the territory is about 22.3%. [12] However, even though the territorial government launched its Indigenous hiring preference program in October 2020, the percentage of Yukon government employees who self-identify as Indigenous remained at 14% in 2022. [13] To address this challenge, the Yukon government launched a public engagement process in June 2023 aimed to obtain feedback from Yukoners to learn how to increase the representation of Indigenous people within the public service. [14]
Increasing government funding also contributes to employment expansion within the public administration sector. For example, the Yukon government has allocated an additional $3.5 million in core funding this year for the RCMP to hire more police officers, upgrade equipment, and cover operating costs. Part of the funding will go toward 6.5 new full-time officers and one staff member. [15]
Northwest Territories
Employment in the NWT's public administration sector increased significantly in 2020 (+20.4%) and in 2021 (+6.8%). up 20.4%. However, in 2022 employment declined by -6.3% to end up at 5,900 people. Despite the employment decline in 2022, employment level was up over 20.0% from pre-pandemic levels. [16] Employment growth during the pandemic is likely due to the government introducing new initiatives to combat the COVID-19 crisis. The Government of Northwest Territories, for instance, hired an additional 700 workers during the pandemic, including 130 in a temporary COVID-19 secretariat. [17]
In 2022, the average weekly earnings for the federal government public administration in the NWT was $2160,27 and $2153.20 in territorial public administration. [18]
Over the past few years, Northwest Territories has been experiencing a historic number of flooding and wildfires in the territory. In response to these crises, all levels of government have allocated funding to support various critical aspects of wildfire and flood management, including enhancing prevention measure, equipping firefighters and disaster recovery initiatives. For example, the federal government has provided $15 million to the NWT through the Territory's Disaster Financial Assistance Arrangements (DFAA) program to provide recovery costs associated with the territory's spring floods in 2021 and 2022. [19]
Nunavut
Nunavut's public administration sector has had its ups and downs over the past few years. Employment in the sector dropped 5.4% during the COVID-19 pandemic in 2020 compared to a year ago. The sector's employment rebounded (+20.0%) in 2021, however, it fell considerably (-14.3%) in 2022. [20]
In 2022, the sector's average weekly earnings for the federal government in Nunavut ($2,364.06) was the highest among all three territories and was above the national average of $1,721.86. Nunavut's average weekly earnings in the territorial public administration was $1,896.16. [21]
Nunavut's public administration sector continues to face critical challenges with attracting and retaining employees due to lack of affordable housing for staff. This issue is particularly acute in Nunavut. In Pond Inlet, for example, about 40% of 183 territorial government positions were vaccant in 2022 due to limited staff housing. [22] Overall, the territory's public service had a high vacancy rate of 38%, meaning nearly two in five jobs are unfilled in the territory. [23] The Nunavut government cited lack of employee housing units as one of the major factors for staffing shortages. [24]
The Nunavut government is also working diligently to boost Inuit representation within its workforce, as it has not been able to reach its full target of attaining an 85% Inuit workforce. [25] The Nunavut government is currently working with the federal government and Nunavut Tunngavik Incorporated to create a plan that aims to increase the number of Inuit public servants across the territory. [26] As of December 2022, about 52% of the Nunavut government workforce was Inuit. [27] The terriotrial government is hoping to increase Inuit employment to 66% within the next ten years. [28]
Employment Outlook
Employment in the Territories' public administration sector is driven by population growth and depends on government revenues and spending. As the population increases, there is often greater demand for public services such as firefighters and policing. Government spending also plays a crucial role for the public administration sector. When government budgets face constraints or expansions influenced by factors such as economic downturns, alternations in regulations and policies, natural disasters and pandemic crises, they could either limit or enhance the government's ability to increase their overall workforce.
Population growth in the Yukon has been strong in recent years, mostly due to international migration. Immigration to Yukon rose in 2021–22 and will likely remain elevated in the years to come. The Conference Board of Canada forecast that net international migration should add about 500 people to the population annually for the next five years. It also forecasts that net inter-provincial migration into Yukon will remain positive in the next five years. This increase in population over the short-term will lead to increased demand for government services in Yukon.
Furthermore, government revenues should be generally positive for the foreseeable future. Strong wage gains are likely to support personal tax revenue intake. There should also by rising royalty revenues due to a strong mining sector. The Territorial Formula Financing transfers should also increase as the population increases. [29] Strong population growth combined with bolstered government revenues should result in a positive outlook for the public administration sector in Yukon.
Population growth in Nunavut is also projected to be strong over the next few years, which should increase demand for the public administration sector. The Conference Board of Canada predicts that Nunavut's population will grow at an average annual rate of 1.2% over the next decade, partly due to a high fertility rate. Government revenues are expected to be robust in the coming years, as the strong population growth will increase Territorial Formula Financing transfers and an expanded mining sector contributes to increased tax revenue. [30] Strong population growth and increased government revenues will ensure a positive outlook for the short term in the public administration sector in Nunavut.
Of all the territories, population growth is weakest in the Northwest Territories. The Conference Board of Canada projects a net loss via migration to other provinces and territories that will outweigh positive net international migration. Although corporate taxes and mining royalties will likely result in surpluses in the short term, slow population growth will weaken revenues that are accrued from the Territorial Formula Financing transfer and will slowly weaken the territories tax base. [31]
Although the low population growth and potentially shaky territorial finances may dampen some of the outlook for the public administration sector, public spending by the territorial and federal governments after the record-breaking wildfire season in 2023 should increase the outlook for certain occupations in the sector. The federal government announced in September 2023 that it will be providing the NWT government with $28.5 million in funding for wildfire equipment and personnel. [32] The NWT government also allocated a total of $100 million to the Department of Environment and Climate Change's wildfire suppression budget for the 2023 financial year. [33]
Endnotes
-
Statistics Canada (2022). Labour Force Survey. ESDC custom table. ↑
-
Statistics Canada. North American Industry Classification System (NAICS) Canada 2022 Version 1.0. 91 - Public Administration. ↑
-
Statistics Canada (2023). Gross domestic product (GDP) at basic prices, by industry, provinces and territories. ↑
-
Statistics Canada (2022). Labour Force Survey. ESDC custom table. ↑
-
Statistics Canada (2022). Labour Force Survey. ESDC custom table. ↑
-
Statistics Canada (2022). Labour Force Survey. ESDC custom table. ↑
-
Statistics Canada. Table 14-10-0417-01 Employee wages by occupation, annual. ↑
-
Government of Canada (May 30, 2023). Median wages and 10-day speed of service tables. ↑
-
Statistics Canada (2022). Labour Force Survey. ESDC custom table. ↑
-
Statistics Canada. Table 14-10-0204-01 Average weekly earning by industry, annual. ↑
-
Yukon Bureau of Statistics (June 19, 2023). Survey of Employment, Payrolls and Hours, 2022. ↑
-
Yukon Bureau of Statistics (February 17, 2023). Indigenous People Report, Census 2021. ↑
-
Whitehorse Star (June 27, 2023). YG seeking feedback from Indigenous Yukoners on hiring practices. ↑
-
Government of Yukon (June 26, 2023). The Government of Yukon is seeking feedback from Indigenous Yukoners on hiring practices. ↑
-
CBC News (March 9, 2023). Yukon boosts RCMP budget by $3.5M to add more officers, update equipment. ↑
-
Statistics Canada (2022). Labour Force Survey. ESDC custom table. ↑
-
Government of Northwest Territories (September 3, 2020). Government of Northwest Territories Announces creation of COVID-19 Coordinating Secretariat. ↑
-
Statistics Canada. Table 14-10-0204-01 Average weekly earning by industry, annual. ↑
-
Government of Canada (September 11, 2023). Government of Canada provides disaster recovery funding to Northwest Territories. ↑
-
Statistics Canada (2022). Labour Force Survey. ESDC custom table. ↑
-
Statistics Canada. Table 14-10-0204-01 Average weekly earning by industry, annual. ↑
-
Nunavut News (March 10, 2022). Vacant GN positions, lack of staff housing concern Tununiq MLA. ↑
-
Government of Nunavut (April 2023). Towards a Representative Public Service – Statistics of the Public Service within the Government of Nunavut as of: December 31, 2022. ↑
-
CBC News (June 22, 2023). 2 in 5 jobs at the Government of Nunavut are unfilled. ↑
-
CBC News (June 22, 2022). Inuit representation in Nunavut public service stalls at 50%. ↑
-
CBC News (June 22, 2023). 2 in 5 jobs at the Government of Nunavut are unfilled. ↑
-
CBC News (May 10, 2023). Plans for Inuit employment breach Nunavut Agreement, arbitrator rules. ↑
-
Government of Nunavut (July 2019). Inuit Employment Plan to 2023. ↑
-
Conference Board of Canada (April 27, 2023). Forging Ahead: Yukon's Outlook to 2045. ↑
-
Conference Board of Canada (April 27, 2023). A Brightening Sky: Nunavut's Outlook to 2045. ↑
-
Conference Board of Canada (April 27, 2023). Charting New Paths: The Northwest Territories' Outlook to 2045. ↑
-
Government of Canada (September 8, 2023). Government of Canada Commits Significant Funding for Wildfire Equipment and Provides Update on 2023 Wildland Fire Season Forecast. ↑
-
Cabin Radio (August 28, 2023). MLAs approve additional $75M for fire suppression. ↑
- Date modified: